AMSTAT Alternatives: Flight Activity And Utilisation Data Beyond Ownership Records

AMSTAT has been the default aircraft market data product for decades.
If you need to know who owns a tail, what year it was built, what serial number it carries, when it last sold, and which operator it is registered against, AMSTAT delivers.
For brokers running listings and lessors checking title chain, that data is foundational.
It also has a structural blind spot.
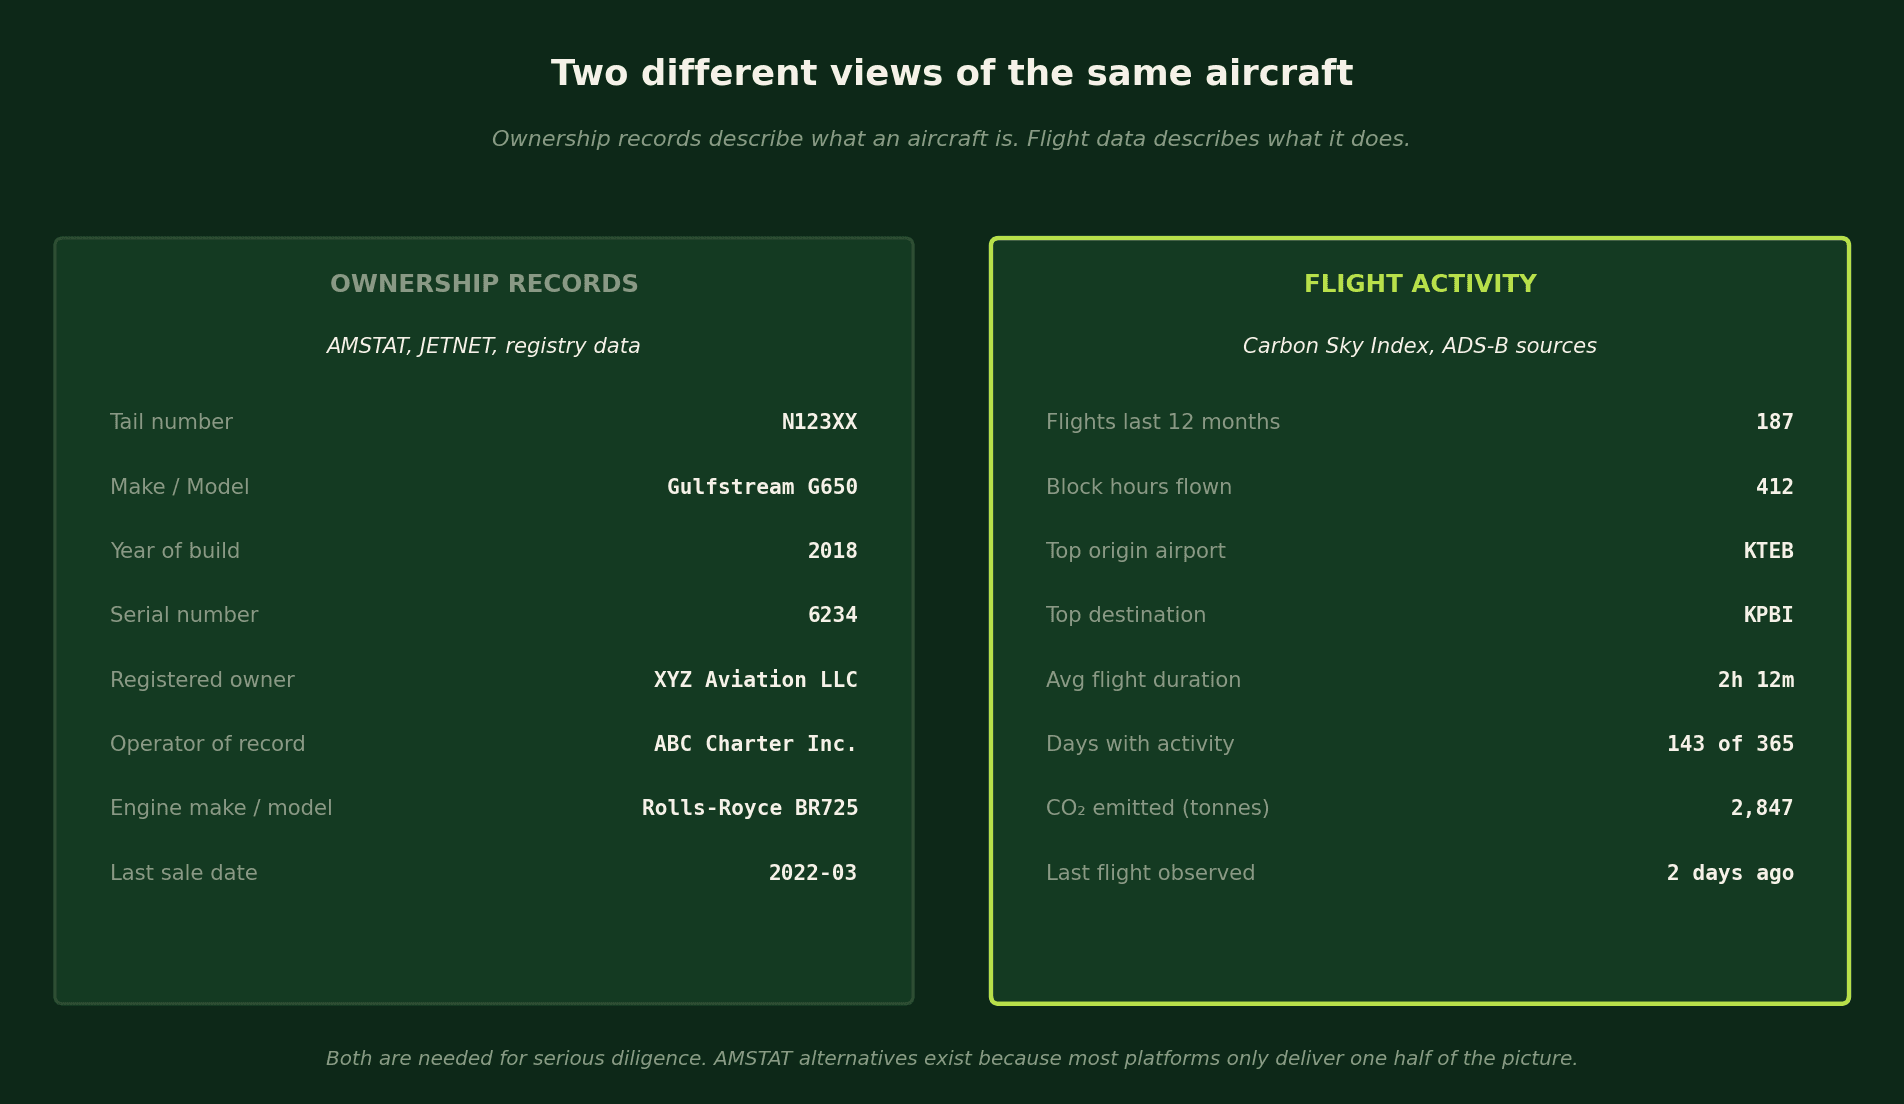
AMSTAT describes what an aircraft is.
It does not, in any meaningful operational sense, describe what an aircraft does. For lenders pricing risk, fractional operators benchmarking fleet productivity, and analysts modelling residual value, that gap is the entire job.
This article is a working guide to the most useful AMSTAT alternatives, with a particular focus on the platforms that fill the activity-data gap.
We pull live data from Carbon Sky Index (CSI), which tracks 2.1 million flights across 22,244 unique private aircraft from January 2025 onward, to show what serious flight-activity intelligence actually looks like in practice.
The Gap AMSTAT Leaves
AMSTAT is built on registry data and owner-reported information. That model has two consequences for anyone who needs operational intelligence.
First, AMSTAT records are static.
They update when something administratively changes: a sale closes, a registration moves, an operator agreement is filed.
Between those events, the record sits unchanged for months.
That is fine for confirming title. It is useless for confirming whether an aircraft is actually flying.
Second, registry data tells you nothing about how hard an aircraft is being worked.
A 2018 Gulfstream G650 owned by a holding company in Delaware looks identical to every other 2018 G650 in AMSTAT.
In reality, one of those tails might fly 600 hours a year on transatlantic charter while another sits at a hangar in Scottsdale and flies 30 hours a year for personal use. Same registry record. Completely different asset.
Two aircraft can have identical registry data and entirely different commercial reality. Activity data is what tells them apart.
Who Actually Needs Flight Activity Data
Three audiences have moved hardest toward flight-data alternatives in the past 18 months.
Aviation Lenders And Lessors
Residual value is a function of utilisation.
A high-time airframe holds different value, and carries different lending risk, than a low-time airframe of the same age and model.
AMSTAT will tell you the build year. It will not tell you whether the aircraft has flown 800 hours in the past 12 months or 80.
For pricing maintenance reserves, structuring loan-to-value ratios, and forecasting residual at lease end, that distinction is everything.
Lenders also need recency signals.
An aircraft that has not flown in the past 90 days is a different credit profile than one flying weekly.
Static ownership records cannot deliver that signal.
Fractional Operators And Charter Networks
Operators benchmarking their fleet against the wider market need utilisation distributions, not ownership snapshots.
The right question is rarely "who owns this aircraft type" and almost always "how much is this aircraft type actually flying, and where".
For fleet planners deciding whether to add Phenom 300s or Challenger 300s, the productive utilisation gap between the two is more important than the price tag difference.
Aircraft Market Analysts
Analysts forecasting demand, modelling fleet renewal cycles, and writing investment theses for aviation-exposed funds need aircraft market data that captures movement, not just inventory.
Static fleet counts are a starting point. Flight intensity, route concentration, airport-level demand, and tail-by-tail activity are the real inputs to a defensible forecast.
AMSTAT Alternatives At A Glance
There is no single platform that does everything AMSTAT does and adds full activity data on top.
The honest picture is that the best AMSTAT alternatives complement registry data rather than replace it.
The question is which alternative best matches your use case.
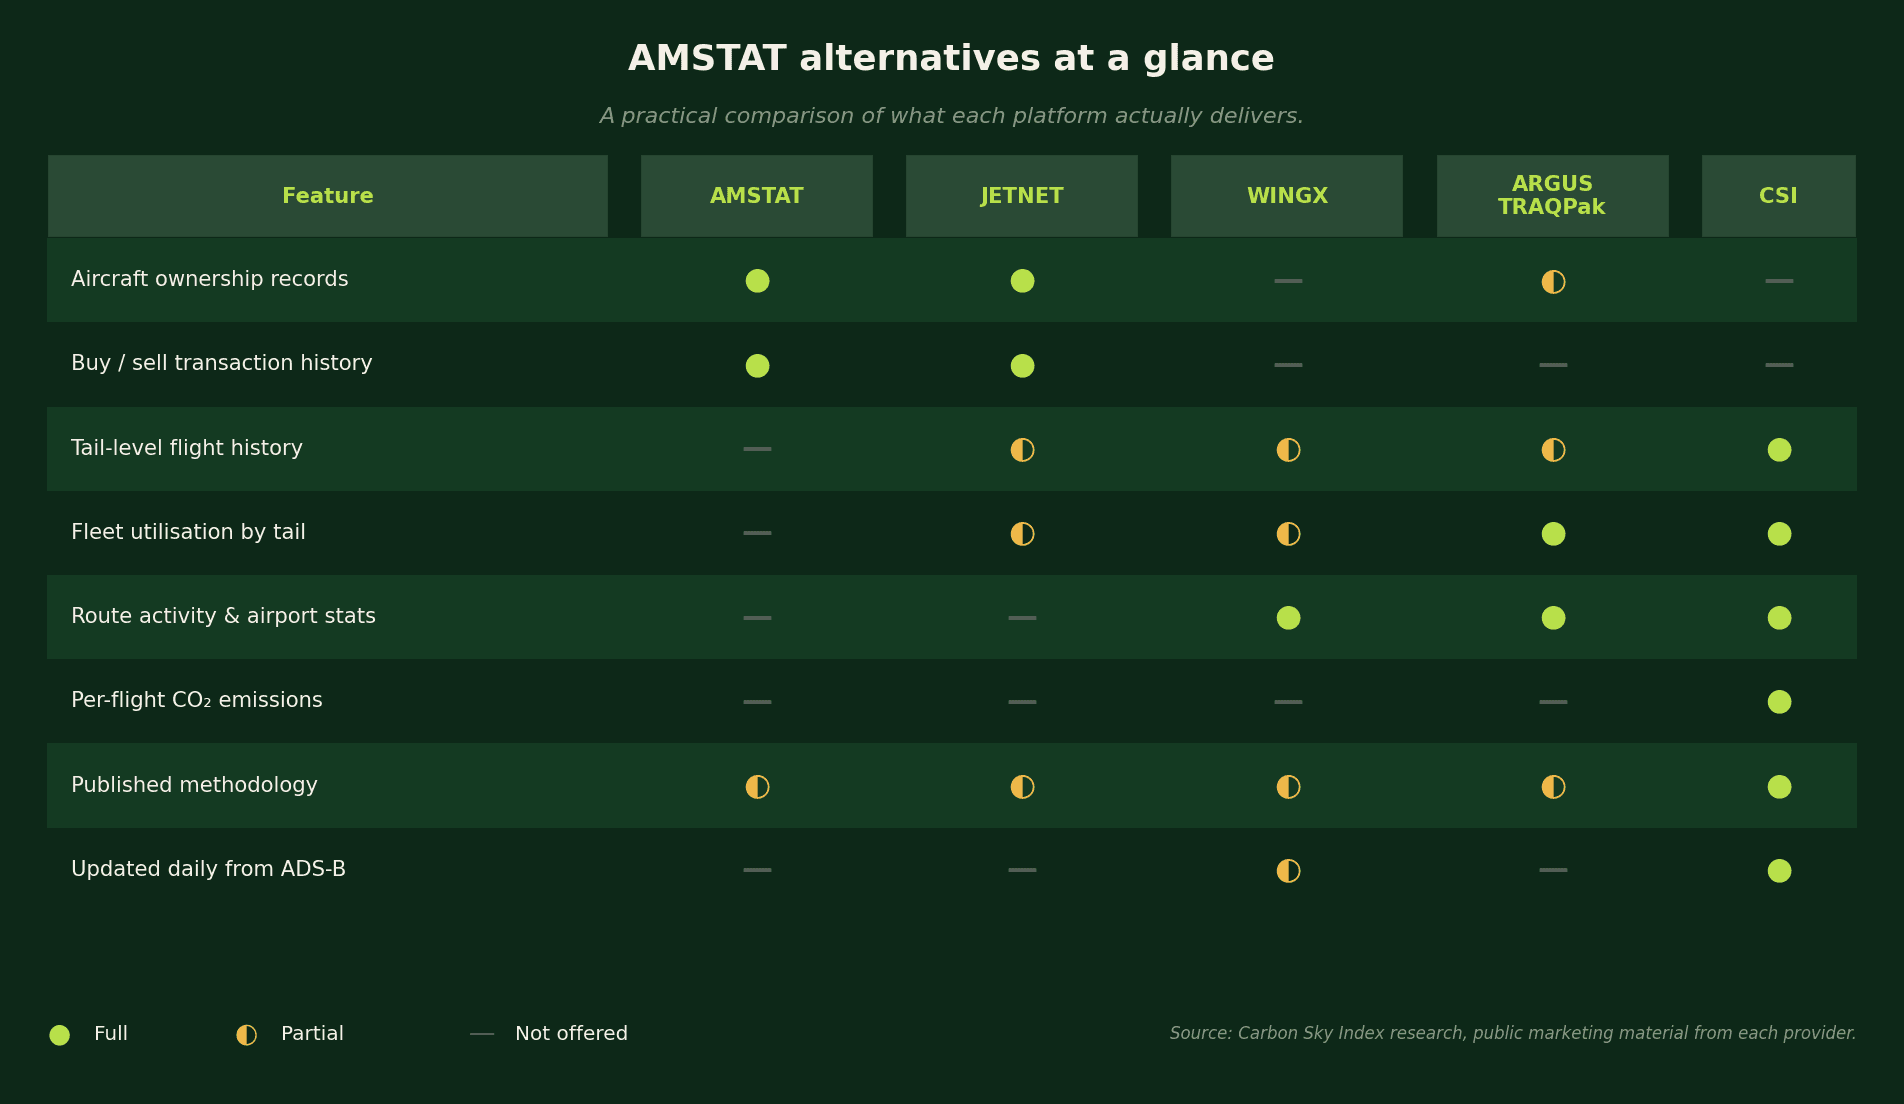
Three things stand out from this comparison.
JETNET overlaps heavily with AMSTAT and adds modest activity coverage; it is the closest like-for-like competitor on registry data.
WINGX and ARGUS TRAQPak both deliver fleet-level activity data, but at the aggregate or operator level, not always at tail level.
Carbon Sky Index is the only platform here built around per-flight, per-tail activity and emissions, updated daily from ADS-B.
What Real Flight Activity Data Looks Like
To make the abstraction concrete, here is what private jet utilisation looks like across the most-flown jet types in the global private fleet, drawn from CSI tracking data since January 2025.
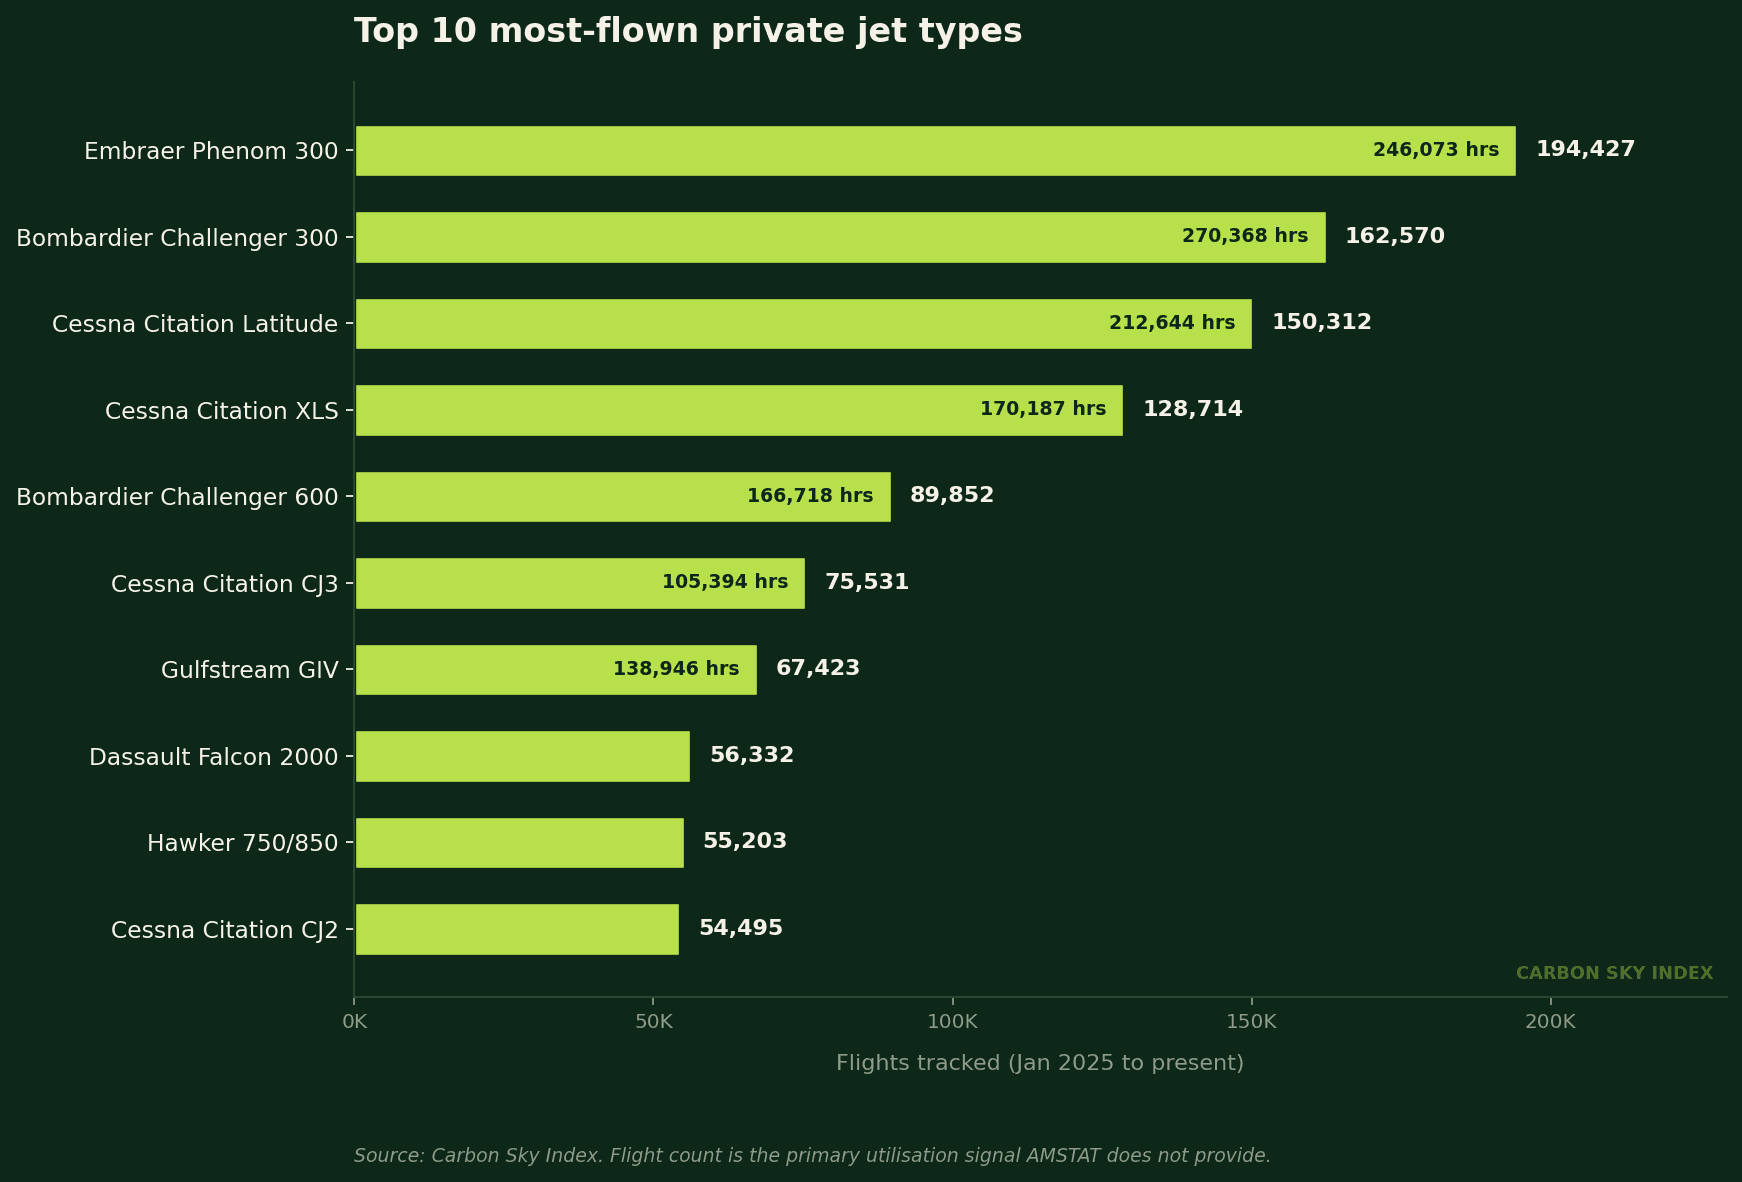
A few things that registry data alone cannot tell you, but flight data does.
The Phenom 300 has logged 194,427 flights at an average of 1.27 hours each: high frequency, short legs.
The Gulfstream GIV, by contrast, has logged 67,423 flights at an average of 2.06 hours each.
The Phenom flies more often, the GIV flies further. For a lessor, those are entirely different residual-value curves.
For an operator, they are entirely different revenue profiles.
You can browse the live ranking, including the highest-emitting tails, at the Carbon Sky Index leaderboard or drill into individual aircraft pages such as the Embraer Phenom 300 or Bombardier Challenger 300 for type-level activity profiles.
Fleet Activity At Airport Level
A second layer of fleet activity data that AMSTAT does not deliver is airport-level concentration.
For FBOs, lessors with regional positioning strategies, and operators making base decisions, departure volumes and unique tail counts at specific airports are the right inputs.
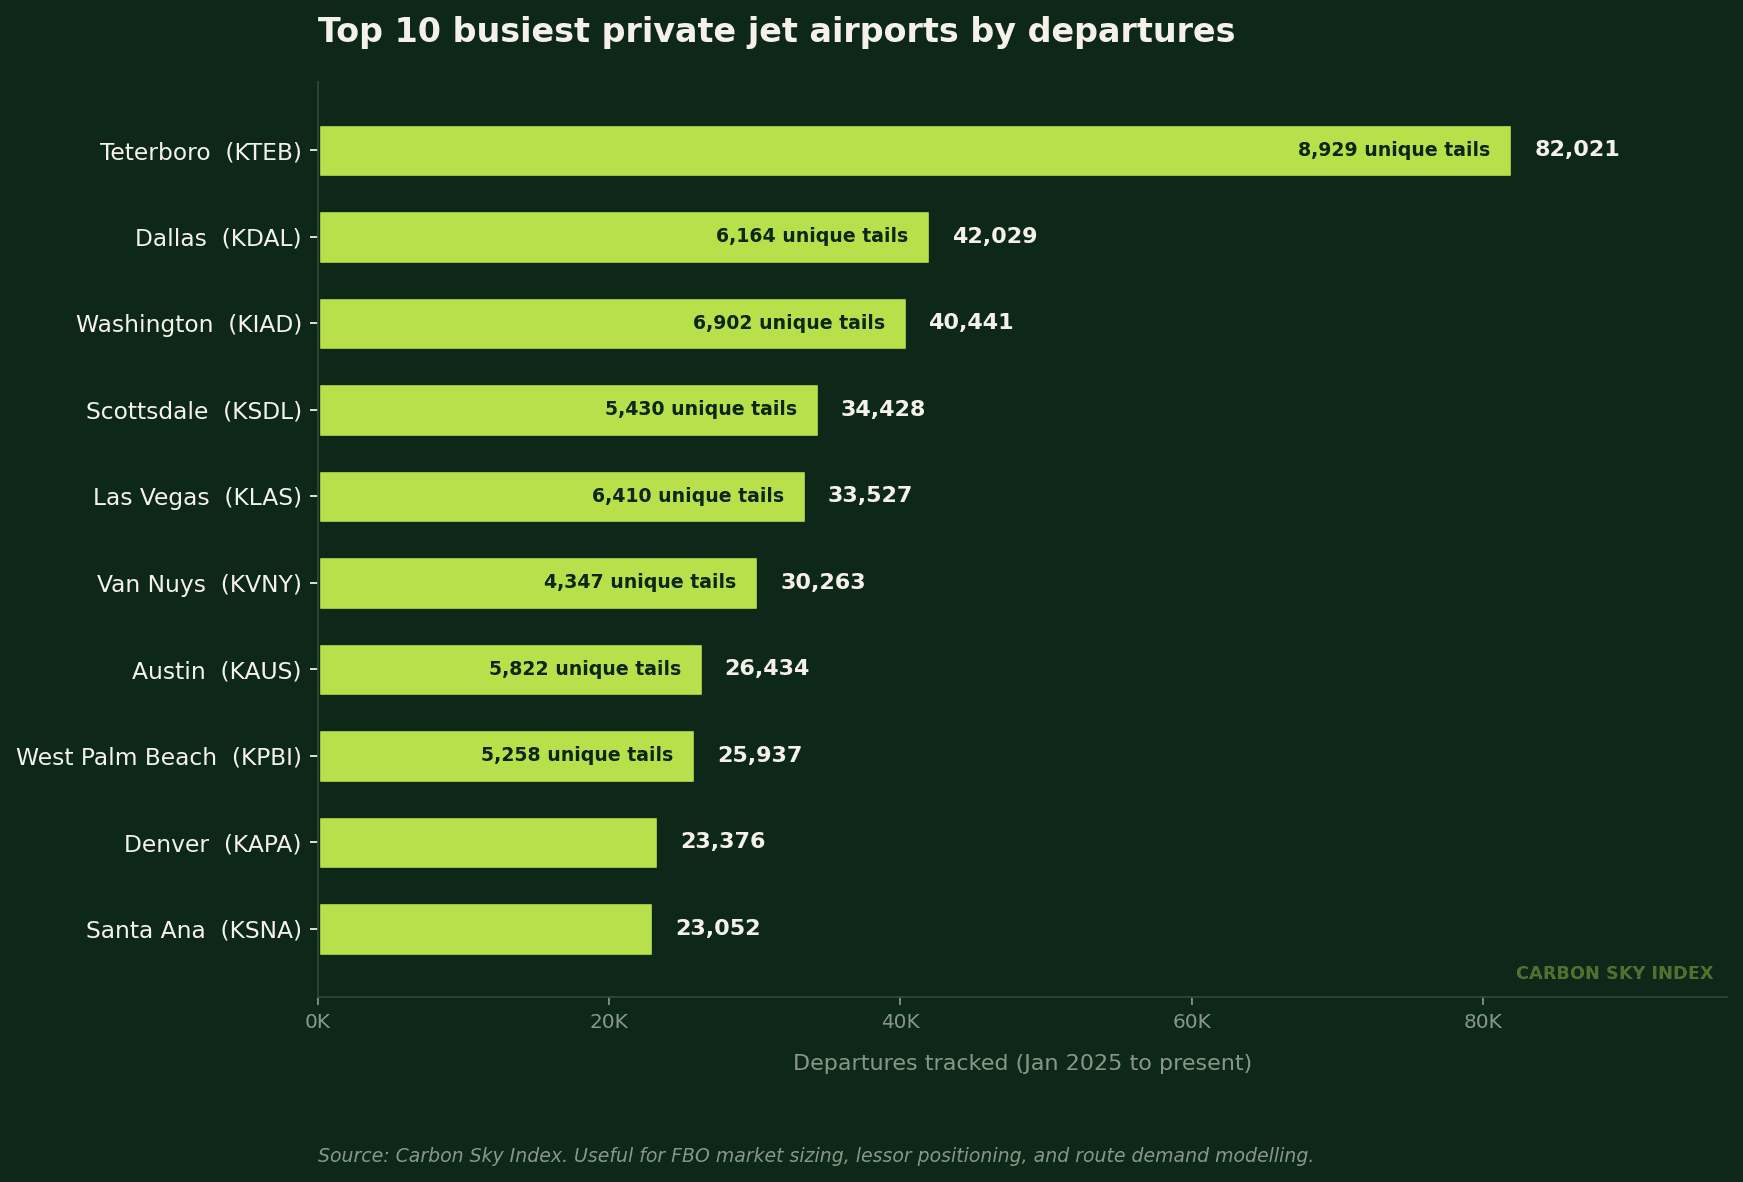
Teterboro is the obvious outlier. 82,021 departures from 8,929 unique aircraft makes it the deepest private jet market in the world by a wide margin.
But the more interesting signal for analysts is in the rest of the table.
Dallas, Washington, and Scottsdale all show high departure counts with smaller unique-tail bases, suggesting more concentrated repeat usage.
Las Vegas and Austin look more like distributed-traffic airports with high unique-aircraft counts.
These are different commercial profiles for any FBO operator or fixed-base lessor evaluating market entry.
CSI maintains live airport pages such as Teterboro (KTEB), Van Nuys (KVNY), and West Palm Beach (KPBI), each showing rolling departure activity and aircraft mix.
These are the underlying primitives for any serious aviation analytics platform.
The Long Tail Of Private Jet Utilisation
One of the most useful exercises flight data unlocks is mapping the utilisation distribution across the entire tracked fleet.
This is the single most important picture for any lender, lessor, or analyst trying to understand how concentrated activity actually is.
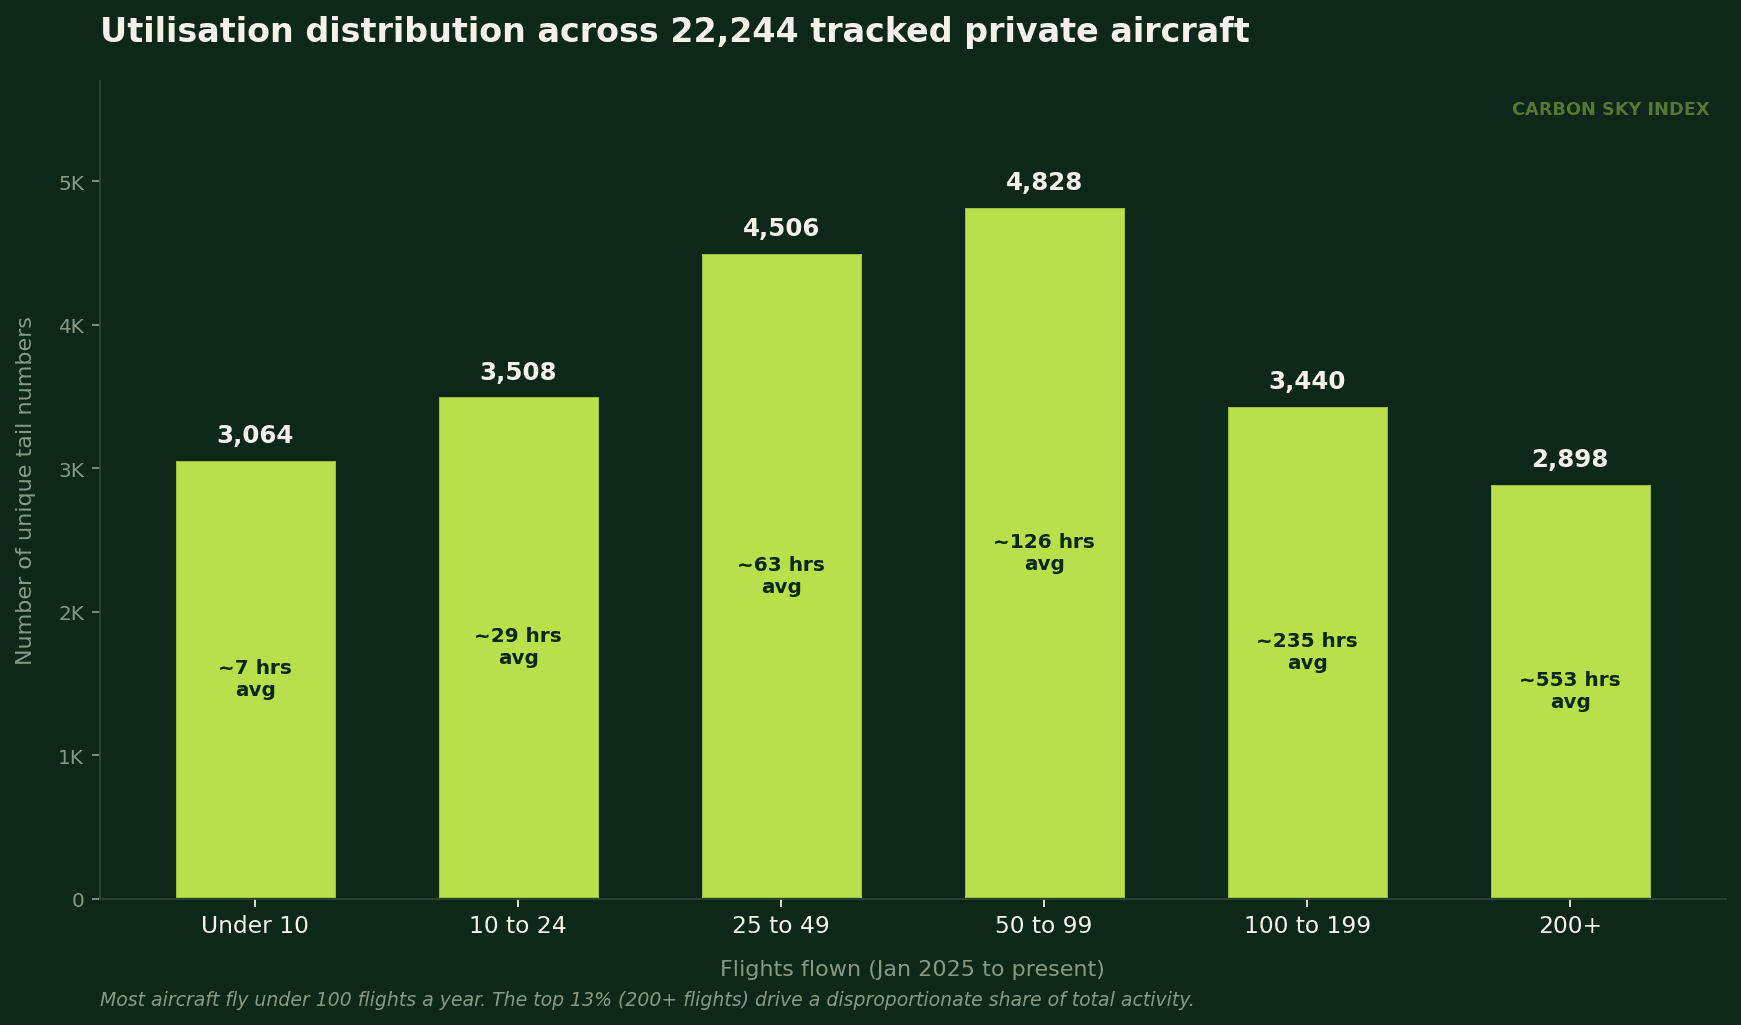
Across 22,244 tracked aircraft, the distribution is heavily skewed.
Roughly 31% (6,572 tails) have flown fewer than 25 times since January 2025.
Another 42% sit in the 25 to 99 flight band, the typical owner-flown or light charter profile.
Only 13% of the global tracked fleet has flown more than 200 flights, but that group averages 553 hours each.
These are the workhorses, the heavy-charter and fractional aircraft that drive the majority of total flight hours.
The top 13% of the global private fleet flies as many hours as the bottom 60% combined. Activity, not ownership, is where the value is.
For a lender pricing a portfolio, the implication is direct.
A tail in the 200+ flight band is a different asset than a tail in the under-25 band, regardless of what AMSTAT says about its registry status.
Without flight activity data, that distinction is invisible.
Which AMSTAT Alternative For Which Job
To make this practical, here is a routing guide for the three most common diligence and analysis questions.
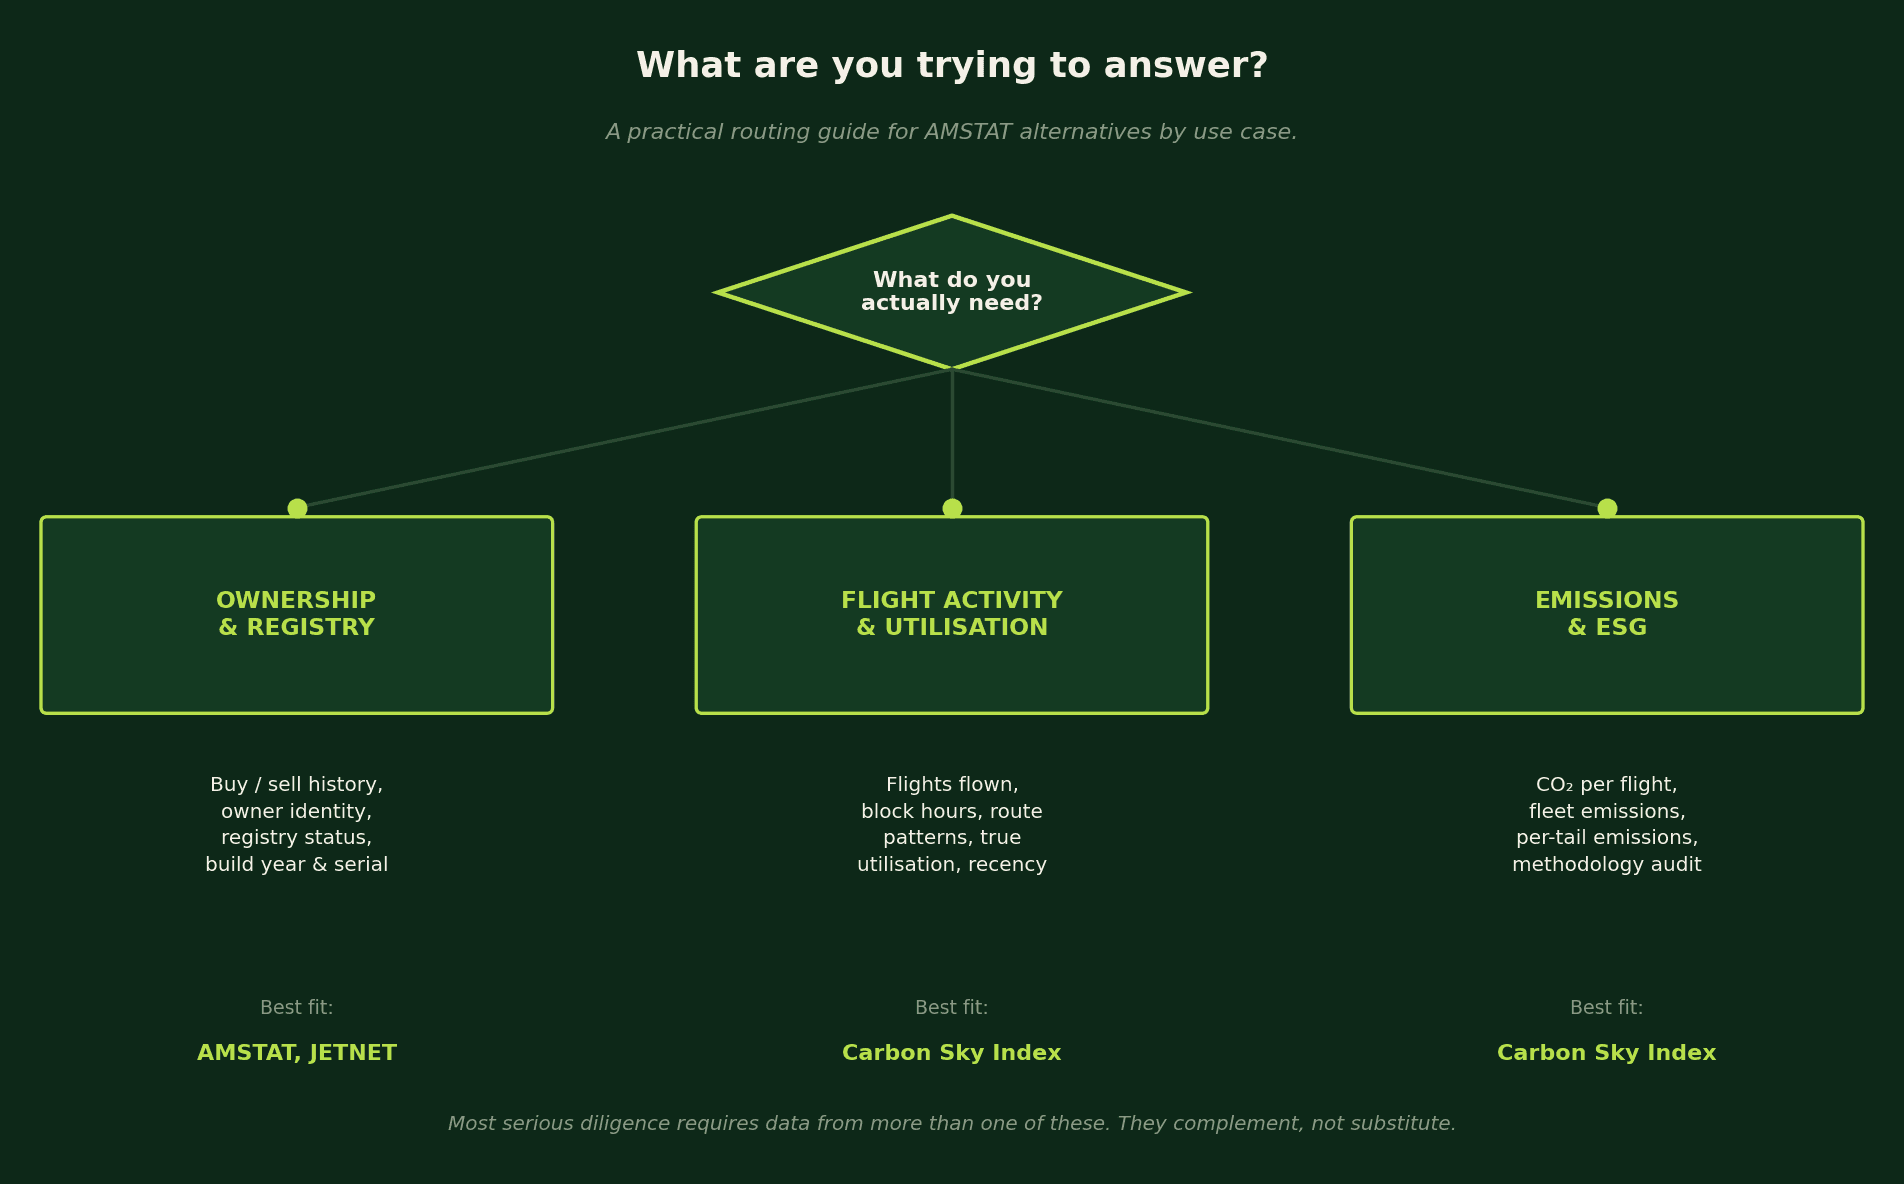
Most serious diligence work uses two of these in combination.
AMSTAT or JETNET for the foundational registry layer; CSI for the activity, utilisation, and emissions layer.
Trying to substitute one for the other is the most common analytical mistake we see.
Why This Matters For Residual Value And Lending Risk
Residual value modelling has historically leaned on registry data because that is what was available.
The frontier now is utilisation-adjusted residual: pricing the asset based on how hard the airframe and engines have actually been worked.
A concrete example.
Two 2018 Bombardier Challenger 300s, both with clean title and identical AMSTAT records.
Tail A has flown 187 flights and 312 block hours in the past 12 months. Tail B has flown 62 flights and 104 block hours.
At lease end, Tail A is going to need a heavier maintenance reserve, will have lower residual value, and represents a different risk profile than Tail B.
Without flight data, both look the same on paper.
This is why every serious aviation finance team and every fractional operator we speak to is moving toward flight-data primary, registry-data secondary diligence.
AMSTAT remains essential for confirming the legal facts. The commercial facts increasingly come from somewhere else.
Where Carbon Sky Index Fits
Carbon Sky Index was built specifically to fill the activity-data and emissions gap that legacy market data products leave open.
The platform tracks 2.1 million private flights across 22,244 unique aircraft, ingested daily from ADS-B sources, with a published methodology based on the EUROCONTROL EMEP/EEA Guidebook 2023.
What CSI delivers that AMSTAT does not:
- Per-tail flight history, updated daily, covering origin, destination, duration, distance, and CO₂ for every tracked flight.
- Fleet utilisation analytics by aircraft type, showing real productive hours rather than registered fleet size.
- Airport and route activity, with departure volumes, unique aircraft counts, and route-level demand signals.
- Per-flight emissions data, the single largest gap in legacy aviation analytics products.
- A fully published methodology so that lenders, ESG analysts, and aviation finance teams can defend the numbers in front of an investment committee.
You can see live activity on the recent flights feed, browse the global emissions leaderboard, or look at specific aircraft like the Cessna Citation Latitude to get a feel for the data depth before deciding whether the platform fits your workflow.
The Honest Conclusion
AMSTAT is not going anywhere.
For ownership records, transaction history, and registry intelligence, it is still the reference product.
The mistake is treating it as the whole picture.
The serious AMSTAT alternatives are the platforms that answer the questions AMSTAT cannot: how much is this aircraft actually flying, where, how often, and at what emissions cost.
For lenders pricing risk, fractional operators benchmarking fleet productivity, and analysts modelling the private aviation market, those questions are increasingly the ones that drive the decision.
If you are building diligence workflows, fleet planning models, or aviation market research that depends on what aircraft actually do rather than just what they are, flight activity data is no longer a nice-to-have. It is the layer the decision rests on.
Frequently Asked Questions
Is AMSTAT or JETNET better for registry data?
They are roughly equivalent for ownership records and transaction history. JETNET tends to have slightly better international coverage; AMSTAT is often preferred for North American market depth. For most users, the choice comes down to existing relationships and pricing rather than meaningful data differences.
Can flight data replace AMSTAT entirely?
No, and we would not recommend trying. Flight data tells you what an aircraft does. Registry data tells you what an aircraft is and who owns it. Serious diligence needs both. CSI is positioned as a complement to AMSTAT and JETNET, not a replacement.
How current is ADS-B-based flight data?
CSI ingests ADS-B data daily, with most flights appearing in the platform within 24 hours of touchdown. This is materially fresher than the monthly or quarterly update cycles typical of registry-based products.
What about LADD-blocked aircraft?
A small percentage of private aircraft elect onto the LADD program, which restricts public ADS-B display. CSI documents this limitation transparently in its published methodology rather than concealing it. For the overwhelming majority of the global private fleet, flight data is fully available.
Which AMSTAT alternative is best for ESG and emissions reporting?
CSI is the only platform on this list with per-flight CO₂ calculations and a fully published emissions methodology. For Scope 3 reporting, ESG diligence, or any audit-defensible emissions work in private aviation, that combination is the differentiator.