FlightAware Alternatives for Private Aviation Professionals

If you broker, insure, finance or audit private jets, you have probably hit the same wall. FlightAware is a fine commercial flight tracker, but it was not built for the question you actually need to answer.
You do not want to know whether a flight is on time.
You want to know how often a specific tail flew last quarter, where it went, who flies it, and what that tells you about its value, its risk profile or its emissions.
That is a different product category, and the gap has quietly created an entire ecosystem of FlightAware alternatives aimed squarely at private aviation professionals.
This article is a working guide to that ecosystem.
It is written for brokers pricing aircraft, insurers underwriting hulls and liability, lessors monitoring assets, and ESG analysts running diligence on operators.
We will cover what FlightAware does well, where it falls short for tail-level work, how the main alternatives compare, and which tool fits which workflow.
Why FlightAware is the Wrong Starting Point for Tail-Level Analysis
FlightAware grew up serving general aviation operators, dispatchers and the travelling public.
Its core data product is real-time positional tracking and arrival prediction. That focus shows up in three ways that matter for private aviation work.
The first is filtering.
FlightAware does not natively distinguish between airline, cargo, military and private operations.
You can search by tail number and pull recent flights, but you cannot ask the platform to give you every Phenom 300 movement in Western Europe last month, or every flight by aircraft owned by a specific operator. The data exists; the surface to query it does not.
The second is utilisation context.
A tail number history on FlightAware shows you flights.
It does not show you whether 47 flights in 90 days makes that aircraft a heavy user, an average user or a near-idle asset.
There is no benchmark, no fleet comparison, no hour-totals for valuation work. You see the trees but not the forest.
The third is everything downstream of the flight itself: who owns the aircraft, who operates it under what arrangement, what type of mission profile it flies, and what the emissions footprint looks like.
None of that is in the FlightAware product because none of it is what FlightAware was built for.
So the question is not whether FlightAware is a good product. The question is what to use instead when your job depends on tail-level intelligence.
The Main FlightAware Alternatives at a Glance
There are four serious alternatives that come up repeatedly in private aviation circles. Each one solves a different piece of the puzzle.
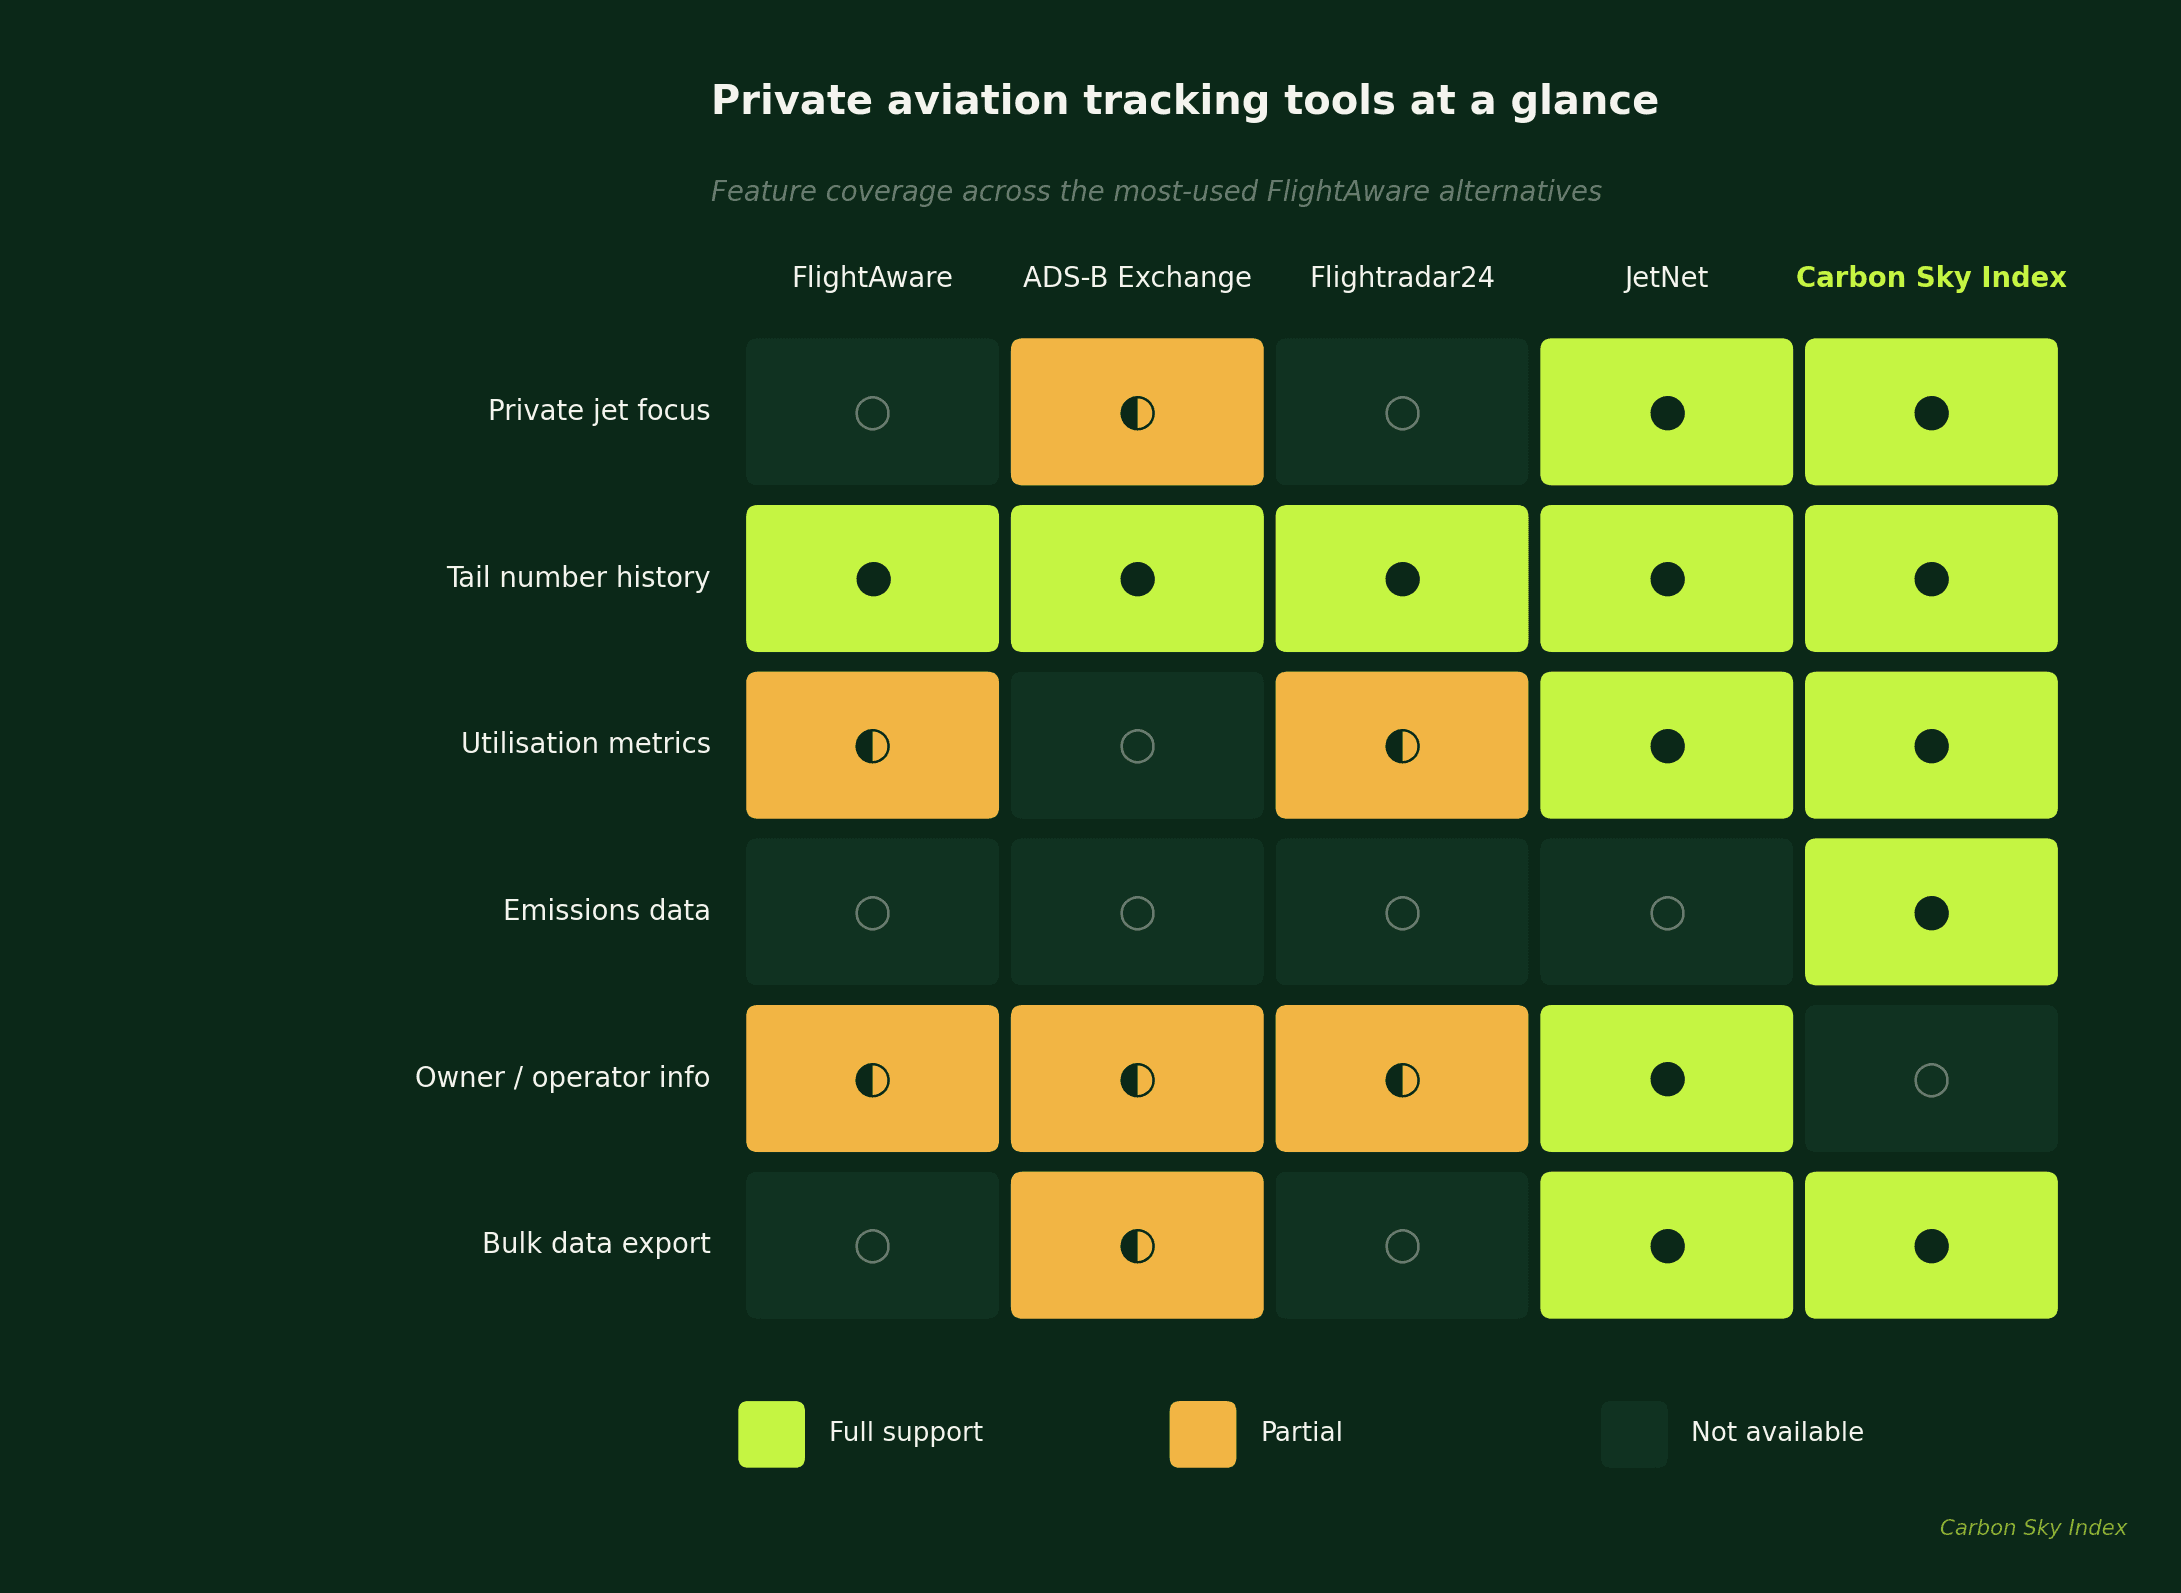
ADS-B Exchange is the unfiltered raw feed. It crowdsources ADS-B data from a global network of receivers and, critically, does not block military or sensitive tails the way commercial trackers do. For analysts who need source-of-truth positional data and are happy to do their own processing, it is invaluable. The trade-off is that it is a data feed, not an analytics platform. You get coordinates and timestamps, not utilisation metrics or owner information.
Flightradar24 is the consumer-friendly tracker most people know. It looks great, the map is fast, and the mobile app is genuinely useful. For tail-level professional work it suffers from the same structural issue as FlightAware. It was built for the public, not for analysts.
JetNet is the incumbent in private aviation business intelligence. It has deep historical data on transactions, ownership, valuations and movements going back decades. It is the standard reference for the brokerage community. It is also expensive, mostly UI-driven, and not designed around emissions or sustainability questions.
Carbon Sky Index is the newest entrant and the one we built. It focuses specifically on private aviation, blends ADS-B-derived flight data with calculated emissions on a per-tail basis, and surfaces the whole thing through a clean analyst-focused interface. We will get into where it fits below.
What "Good" Looks Like for Tail Number Flight History
Before picking a tool, it helps to be specific about what tail number flight history actually needs to contain to be useful.
From our work with brokers, lessors and insurers, the requirements consistently break down into four buckets.
Movements need to be clean.
That means every flight in a defined period, with origin, destination, departure time, arrival time and block hours, and no spurious entries from tower reflections, ground movements that look like takeoffs, or duplicate hex codes.
Dirty data is the silent killer here.
A tracker that inflates flight counts with false positives makes an aircraft look harder-flown than it is, which can move a broker valuation in the wrong direction.
Conservative segmentation is the right default for professional work.
Aircraft context needs to be attached.
Type, variant, age and registration country all condition how the flight data should be interpreted.
A Phenom 300 doing 1.3-hour average sectors looks normal.
A Gulfstream GIV doing the same looks like positioning flights or a charter operation, not owner-flown missions.
Utilisation needs to be benchmarked.
A standalone count of flights tells you almost nothing without distribution context.
Is 47 flights in 90 days a lot? It depends entirely on what comparable aircraft are doing.
Emissions need to be calculable.
Even if your immediate question is not sustainability-related, the same data pipeline that lets you compute CO2 per flight (block time, aircraft-specific fuel burn, payload assumptions) is the data pipeline that supports defensible utilisation reporting.
The two are deeply connected.
The CSI recent flights feed is structured around these four requirements.
Every flight has the registration, the aircraft type, both endpoints, the duration, the distance and the calculated CO2.
What the Data Looks Like at Fleet Scale
To make this concrete, here is what private aviation actually looks like across the global fleet we track.
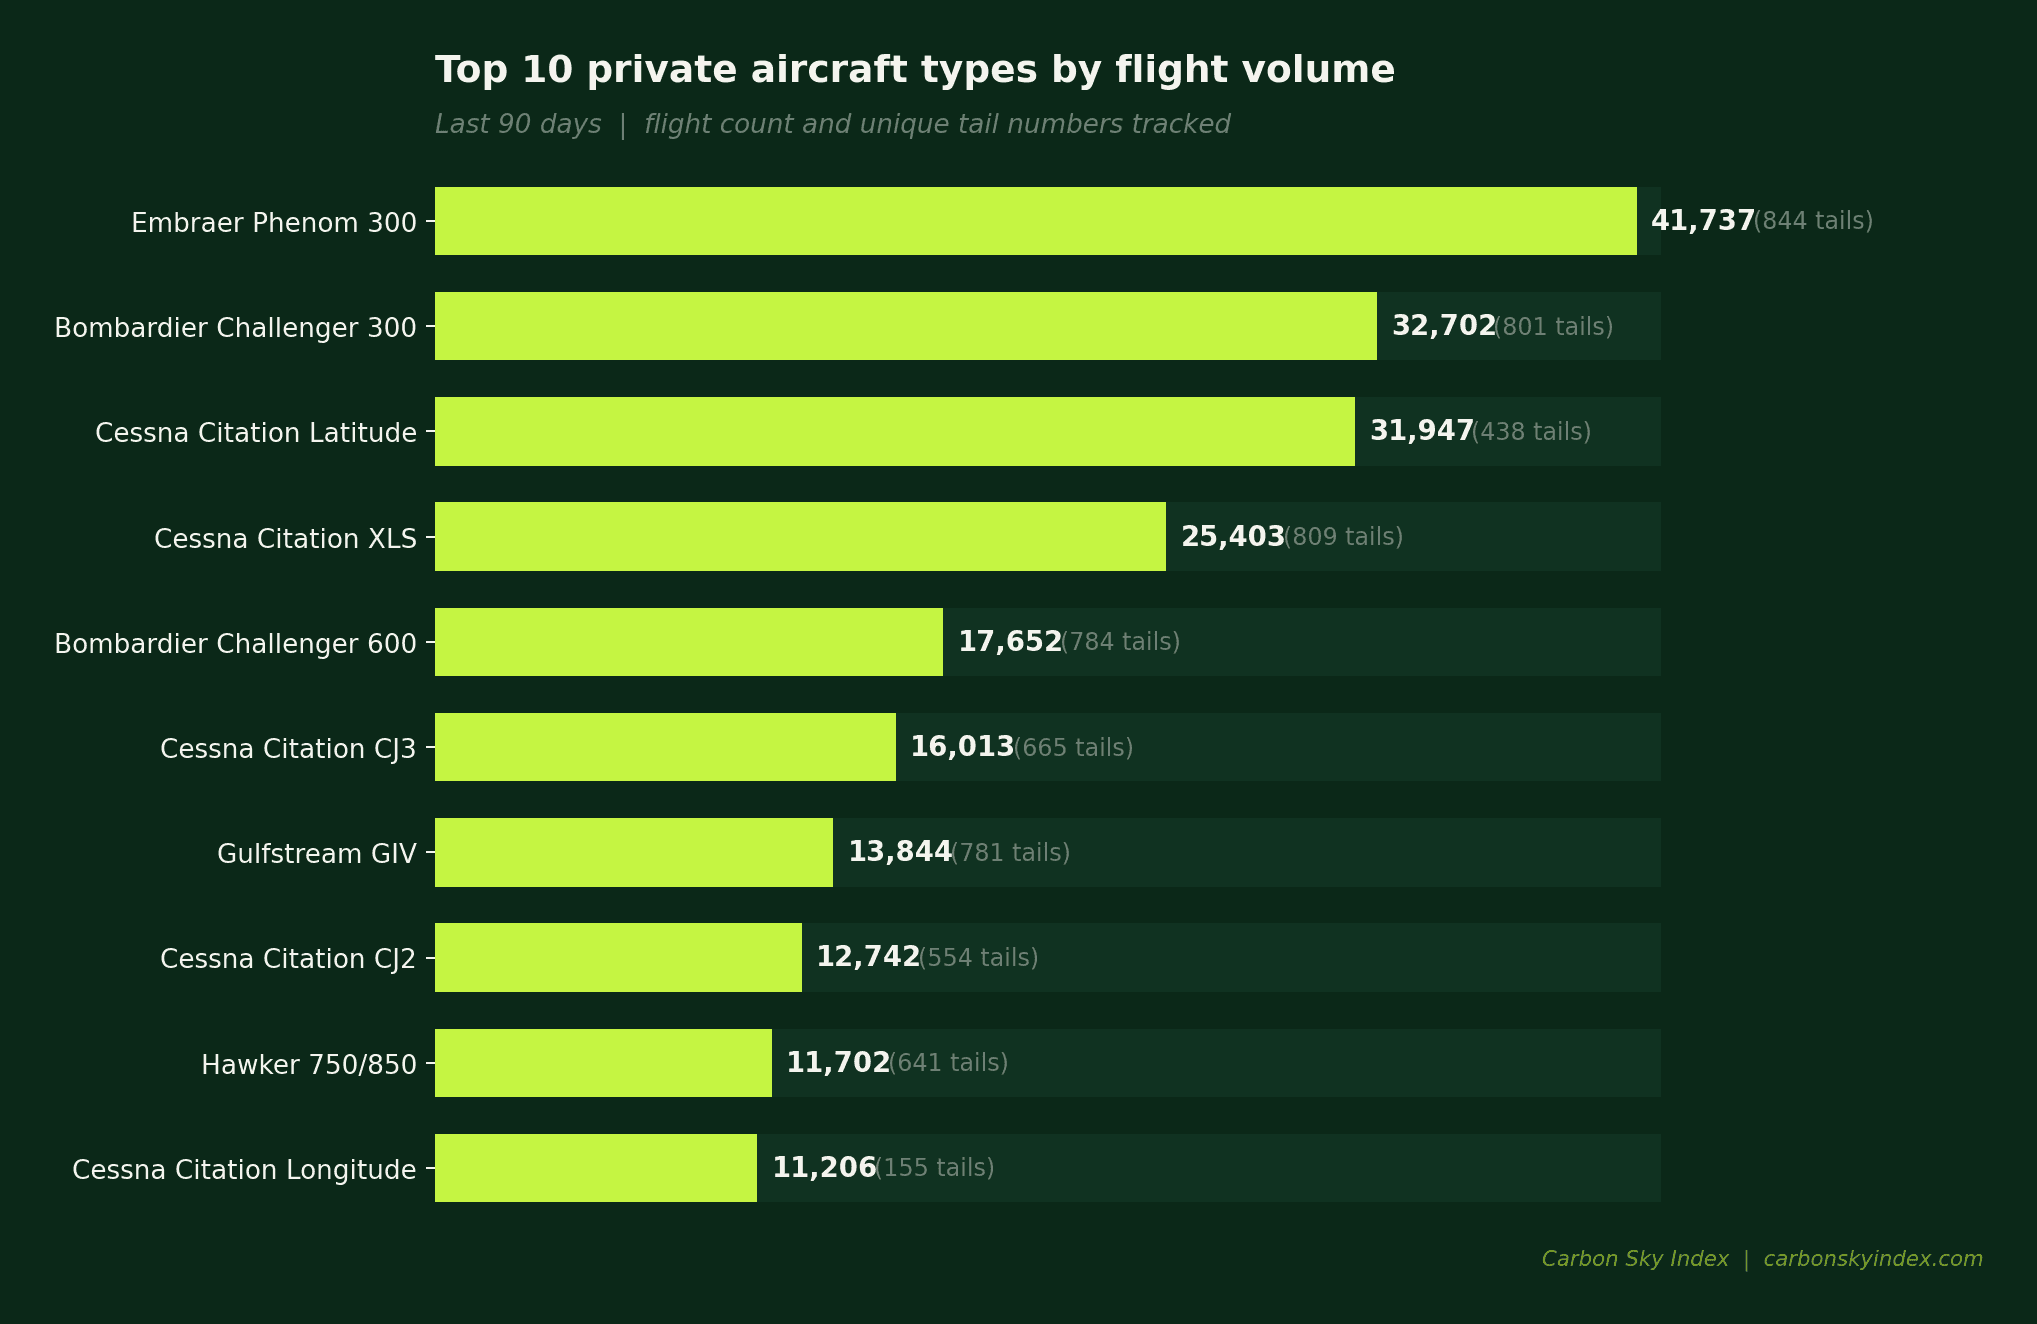
These figures cover the last 90 days of activity across the 22,000-plus aircraft on the platform.
A few things stand out.
The Phenom 300 is comfortably the most-flown private jet type in the world by flight count, with 41,737 movements in 90 days across 844 unique tails.
That is roughly 50 flights per aircraft per quarter on average, which lines up with its dual role as the dominant fractional and charter platform.
The Cessna Citation Latitude is interesting for the opposite reason.
With 31,947 flights spread across only 438 tails, individual Latitudes are flying about 73 flights per quarter on average, materially harder than the Phenom 300.
That is the Latitude's NetJets fractional fingerprint showing up in the data.
The Cessna Citation Longitude is the extreme case: 11,206 flights across just 155 tails, or roughly 72 flights per aircraft per quarter.
That is consistent with a fleet that is overwhelmingly fractional and corporate, with very few owner-flown examples.
For a broker valuing a specific Phenom 300, this fleet context is the difference between a defensible valuation and a guess.
You can look at a tail flying 60 flights a quarter and immediately know it is running 20% above type average, which has direct implications for engine condition, paint and interior wear, and remaining MSP coverage.
How Utilisation Actually Distributes
The fleet-level numbers above hide a more interesting pattern at the tail level.
When you bucket every aircraft we tracked over the last 90 days by flight count, the distribution is heavily skewed.
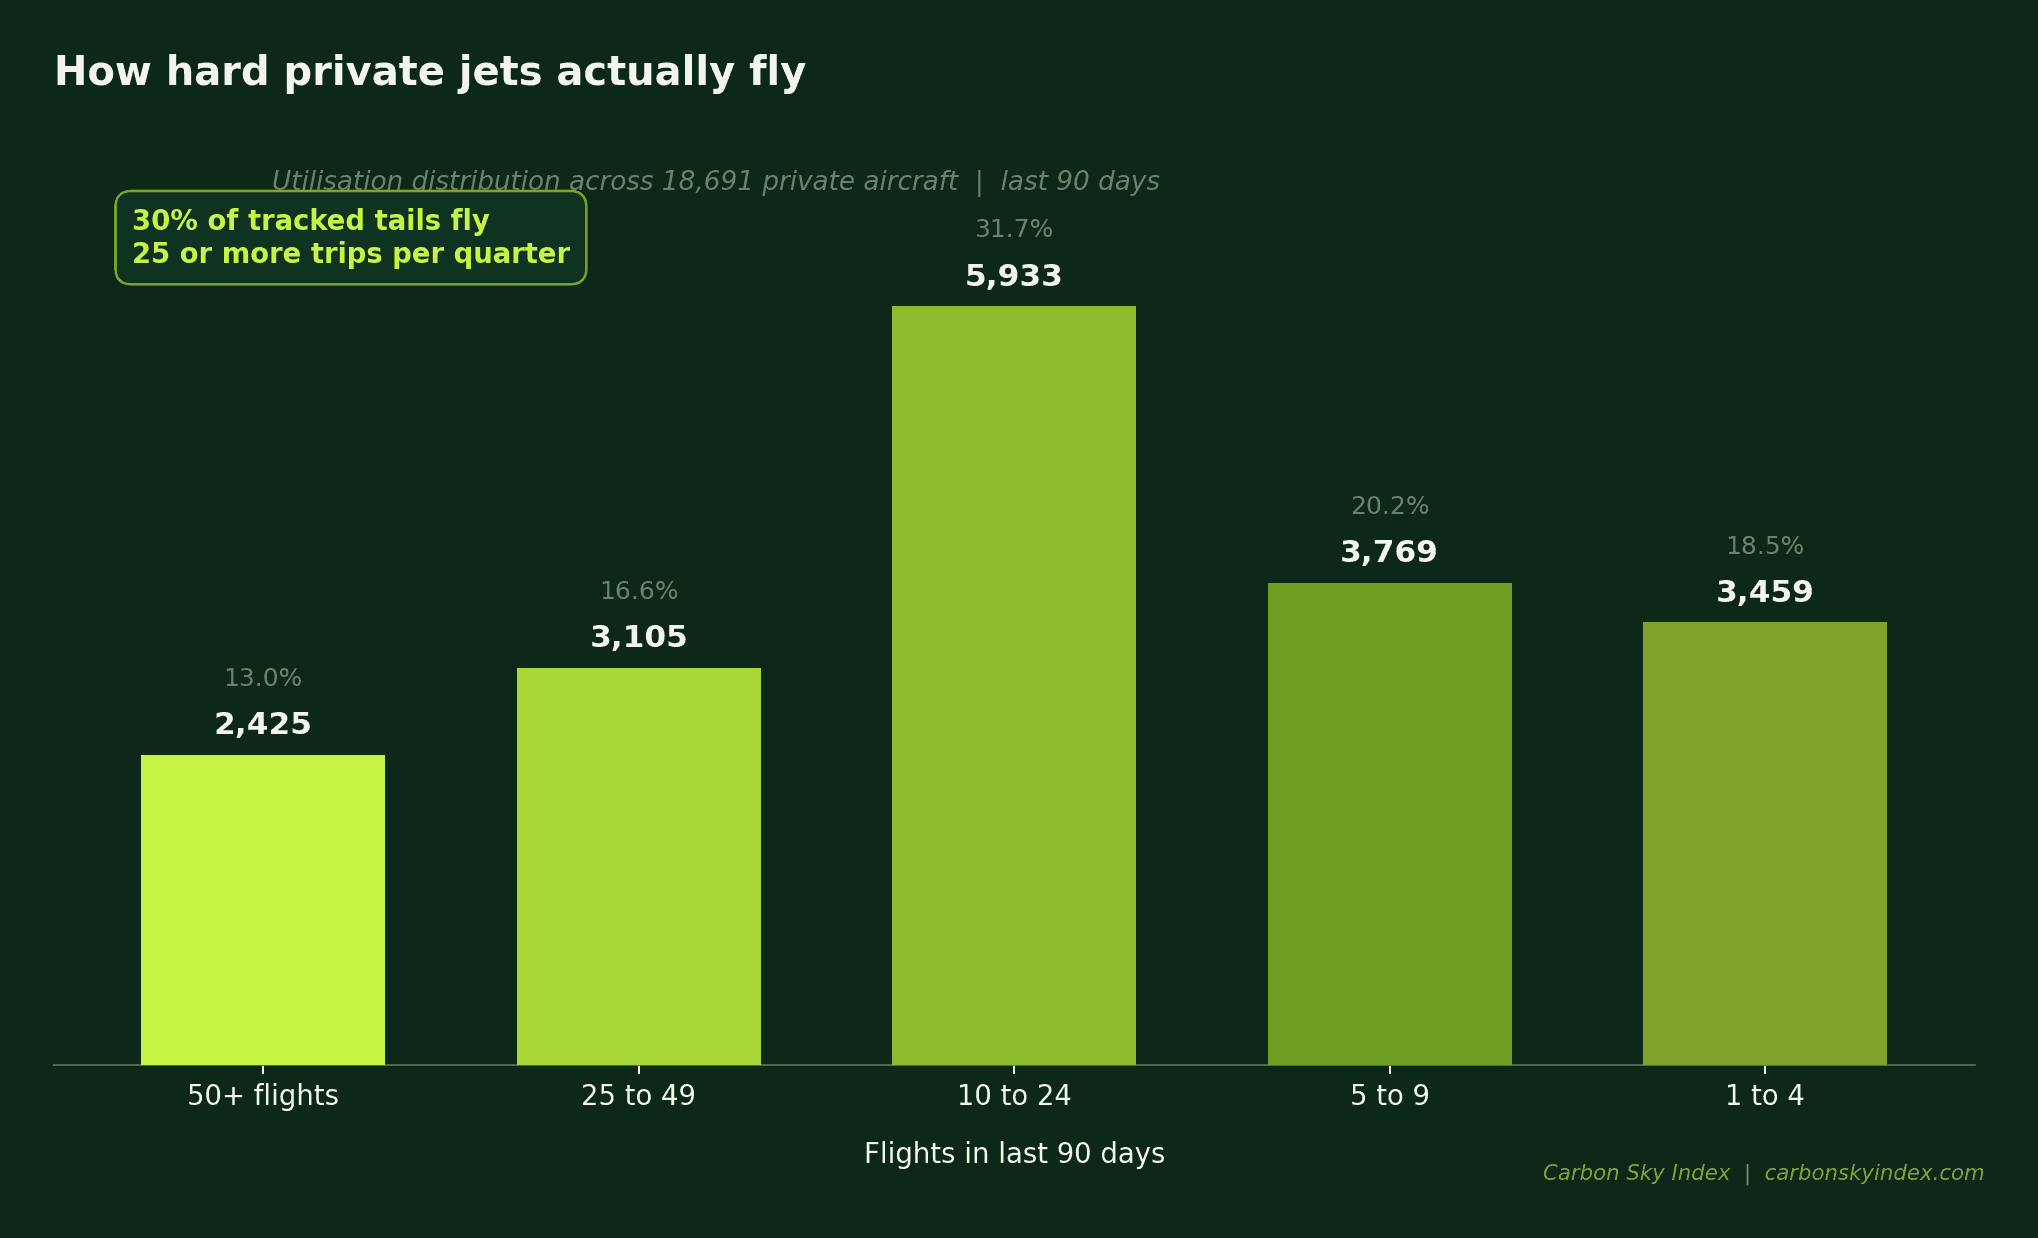
Roughly 30% of tracked tails fly 25 or more trips per quarter. Another third fly 10 to 24 times.
The remaining third fly fewer than 10 times in 90 days. This is the curve that brokers and insurers actually need to internalise, because it tells you that "the average jet" does not really exist.
There are heavy users, moderate users and near-static assets, and they need to be priced and underwritten differently.
For underwriting in particular, this matters.
A hull policy on an aircraft flying 50-plus trips per quarter is not the same risk as the same hull at 5 trips per quarter, even before you start adjusting for mission type, geography or pilot hours.
FlightAware vs ADS-B Exchange for Source Data
A lot of professional users end up running this comparison directly, so it is worth being explicit about it.
FlightAware filters its data and applies commercial restrictions. Some military and sensitive tails are blocked.
Historical access requires a paid Firehose subscription, and the API is structured around individual flight queries rather than bulk fleet analysis.
The data quality is high; the access model is the limitation.
ADS-B Exchange does not filter and does not block.
The full global picture is available, including movements that other trackers redact.
The data is also closer to raw, which is exactly what some analysts want. The limitation is that you are working with positional data that you have to segment into flights yourself, with all the edge cases that involves: tower reflections, ground movements that look like takeoffs, missing equipment changes that confuse aircraft identification.
For most professional workflows, neither raw feed is the right end product. You want the segmentation, the type-matching and the utilisation context already done.
That is what platforms like CSI and JetNet provide on top of the underlying ADS-B layer.
If you are a researcher or building your own model, ADS-B Exchange is the better starting point.
If you are a broker, insurer or analyst who needs to answer business questions, you want a layer on top of it.
Aircraft Utilisation Data: What to Demand from Any Vendor
When you are evaluating private jet tracking tools, there are a handful of questions worth asking explicitly. Vendor demos rarely volunteer this information.
How is a flight defined? Specifically, when does the clock start and stop?
Some platforms use wheels-up to wheels-down. Others use departure-time-out-of-block to arrival-time-in-block.
The two can differ by 20 minutes per flight, which compounds quickly across a fleet.
CSI uses block-time-equivalent durations derived from ADS-B segmentation, calibrated against a reference dataset.
How are aircraft types resolved?
ADS-B identifies airframes by Mode S code and ICAO type designator, but many platforms then have to map those to commercial aircraft names.
Errors in this layer create silent data quality problems where an EMB-505 gets logged as a Phenom 100 when it is actually a Phenom 300.
How is the data delivered?
UI-only access works for ad hoc queries but can break down at fleet scale.
If you need to monitor 200 aircraft systematically, the question becomes whether the platform supports structured exports, scheduled reports or programmatic access.
Bulk export capability is one of the cleaner dividing lines between professional tools and consumer trackers.
Choosing the Right Tool for Your Workflow
Most professionals end up using more than one of these tools, because each one solves a different problem.
Here is a simple way to think about which to reach for first.
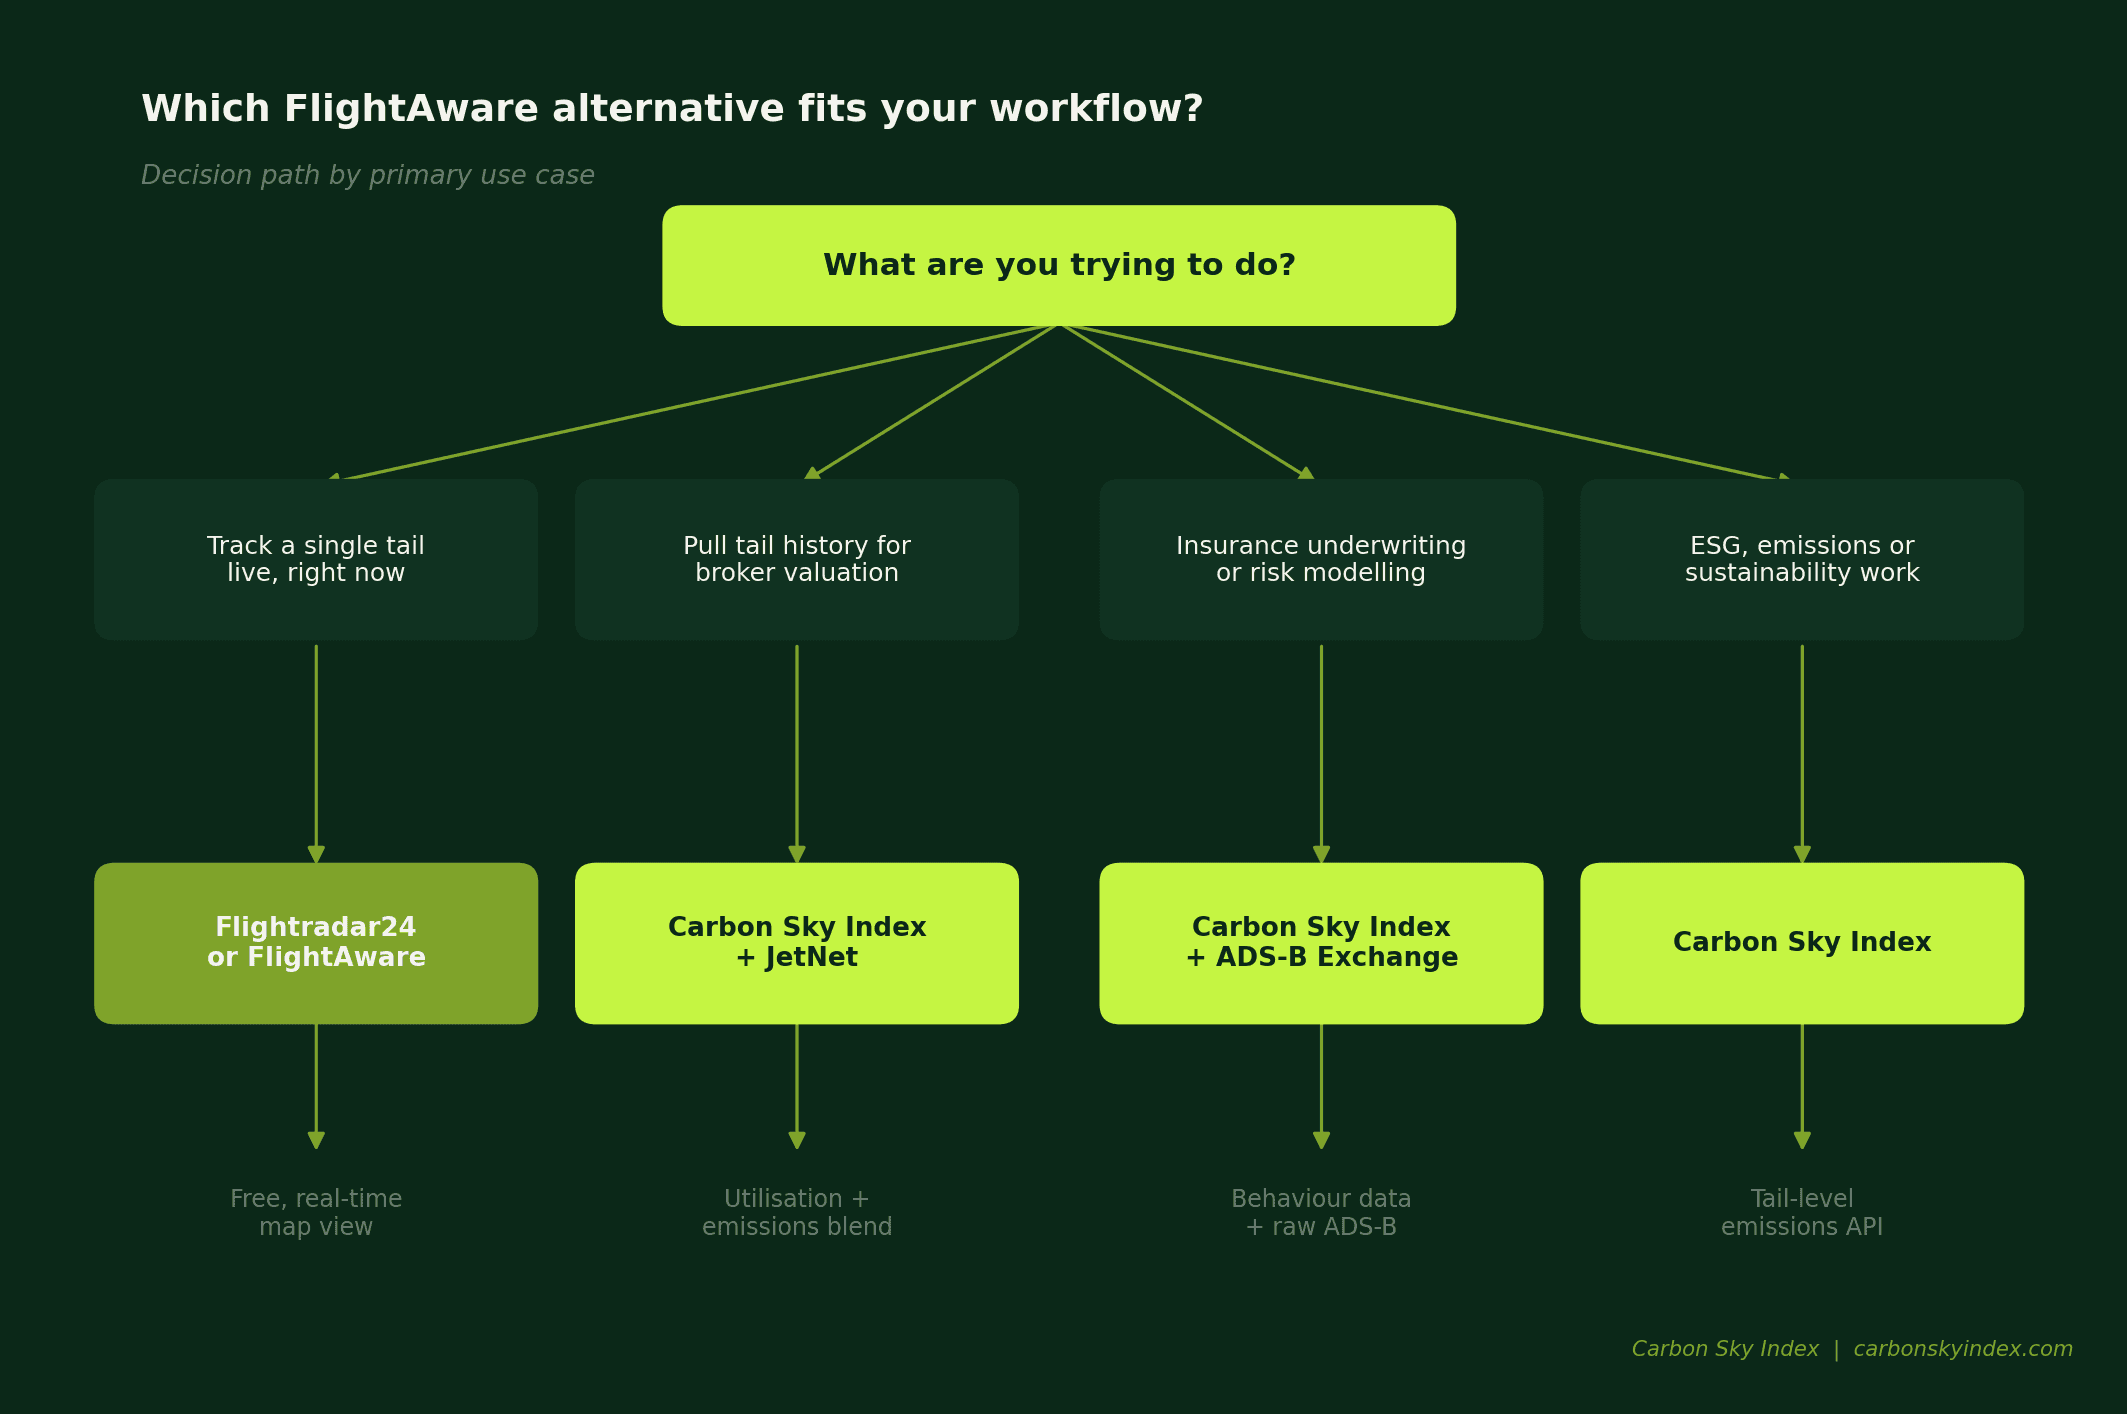
If you need to track a single tail in real time, the consumer trackers are perfectly fine.
Flightradar24 has the best mobile experience. FlightAware is good on the desktop. Both are free at the basic tier.
If you are pulling tail history for broker valuation, the combination of CSI for utilisation and emissions data plus JetNet for transaction history and book values is the standard professional stack.
The two complement each other rather than overlap.
If you are doing insurance underwriting or risk modelling, you need both behavioural data (where, when, how often, for how long) and the underlying ADS-B feed for any anomaly investigation.
CSI provides the behavioural layer with utilisation metrics and tail-level flight histories on the recent flights feed, and ADS-B Exchange supplies the raw positional data for cases where you need to drill into a specific flight.
If your work is ESG, sustainability or emissions-focused, CSI was specifically built for this case.
The platform calculates CO2 per flight using the EUROCONTROL EMEP/EEA Guidebook 2023 methodology across 147 aircraft types, and the methodology page documents exactly how it is done.
Where Carbon Sky Index Fits In
The honest summary of where CSI fits in this landscape: it is the only platform built around the intersection of utilisation and emissions on a per-tail basis.
Every other tool we have discussed treats emissions as either out of scope (FlightAware, ADS-B Exchange, Flightradar24) or as a secondary concern bolted onto a transaction database (JetNet).
For brokers, that means a single source for utilisation context and emissions disclosure, both of which are increasingly turning up in deal memos and lender questionnaires.
For insurers, it means defensible behavioural data for risk modelling and a built-in emissions reporting layer for ESG-aligned underwriting.
For lessors and asset managers, it is monitoring infrastructure that flags utilisation anomalies as they happen rather than during the next quarterly review.
The platform currently tracks more than 21,000 unique tails over a rolling 12-month window, covering 1.67 million flights and roughly 2.7 million block hours.
That is enough fleet coverage to make benchmarking meaningful, and the data goes back far enough to support trend analysis.
You can see the live feed on the recent flights page, browse the heaviest emitters on the leaderboard, or read the methodology for the full technical detail on how everything is calculated.
The Shortlist
For professionals tracking specific tail numbers, the practical shortlist of FlightAware alternatives is small.
ADS-B Exchange is the right tool if you need raw, unfiltered positional data and are comfortable processing it yourself.
Flightradar24 is the right tool for live tracking when you do not need analytics. JetNet is the right tool for transaction history and incumbent valuation work.
Carbon Sky Index is the right tool for utilisation, emissions and the intersection of the two.
You will probably use two or three of these together.
The combination that we see most often among CSI customers is ADS-B Exchange or Flightradar24 for live awareness, JetNet for transactional context, and CSI for utilisation and emissions intelligence at fleet scale.
If your work involves answering questions about how often specific aircraft fly, what they emit, and how that compares to their peers, start with the CSI platform and add the others as you need them.