How Private Jet CO₂ Emissions Are Calculated: A Full Methodology Guide
If you've ever read a headline that says a private jet emitted "X tonnes of CO₂ on a single flight" and wondered where that number actually came from, then this is the article for you.
There is no standardised, regulated way to calculate emissions from a private jet flight. There's no fuel meter feeding data into a public database. Operators don't file CO₂ figures.
So every number you see - whether it's from a tracker, an NGO, a journalist, or an offset calculator - is a model.
The question is what kind of model, what assumptions sit behind it, and what's been left in or stripped out.
This guide walks through how we do it at Carbon Sky Index. It explains the science, the trade-offs, and the limitations.
It also walks through a worked example, taking a single Gulfstream G650 flight from raw ADS-B signal all the way to a final CO₂ figure. This way you can see exactly where every digit comes from.
If you're a journalist citing our numbers, an ESG analyst integrating our data, or a researcher trying to understand how private aviation emissions are quantified at all: this is the foundation document.
Why This Matters
Private aviation emissions are one of the most-cited and least-understood numbers in the climate conversation.
A Gulfstream G650 flight from London to New York might be reported as 25 tonnes of CO₂ in one outlet and 60 tonnes in another.
Both numbers can be technically defensible. They're just measuring different things.
Some calculators include the entire lifecycle of the fuel, from extraction at the wellhead to combustion in the engine.
Others bolt on radiative forcing multipliers to account for contrails.
Some apply load factors to spread the emissions across an assumed number of passengers.
Some use scheduled airline-style block times rather than actual flight duration.
None of these approaches are wrong. But they're not comparable. And when a journalist puts a figure next to a name, the methodology behind that figure has to hold up.
Our position is straightforward: we publish a single, narrow, defensible number - tank-to-wake mission CO₂ - calculated using the EUROCONTROL EMEP/EEA Air Pollutant Emission Inventory Guidebook 2023.
We do not include lifecycle emissions.
We do not apply contrail multipliers.
We do not assume passenger loads.
We do not include reserve fuel, APU burn, or ground power.
What we publish is the carbon dioxide that came out of the engines between takeoff and touchdown.
The Four Inputs: What We Need to Calculate Any Flight
Every emissions figure on Carbon Sky Index is built from four data inputs. Get any one of these wrong and the final number drifts.
- Aircraft identity. We need to know exactly which aircraft flew. Not "a Gulfstream" - the specific tail number, which tells us the airframe, the engine type, and the engine count. A G650 with Rolls-Royce BR725 engines burns fuel at a different rate to a G550 with BR710s. We track 22,000+ private jets by registration, and each one is mapped to a manufacturer-specified fuel burn profile.
- Origin and destination airports. ADS-B signal gives us the flight path, but we anchor each flight to its origin and destination ICAO codes. Those codes resolve to coordinates, which give us great-circle distance.
- Flight duration. This comes from ADS-B detection - the gap between the first and last signal received from the aircraft on that flight. Duration is what drives cruise emissions.
- Engine and aircraft specifications. For each aircraft type, we hold engine count, LTO-cycle fuel flow rates per mode (idle, taxi, climb, takeoff), and a manufacturer-derived cruise fuel burn rate.
That's it. Four inputs. Everything else in the calculation is derived.
The Two Phases of a Flight: LTO and Cruise
The EUROCONTROL methodology splits every flight into two distinct emissions phases, because aircraft engines burn fuel very differently depending on what they're doing.
Phase 1: the Landing and Takeoff cycle (LTO)
The LTO cycle covers everything that happens below 3,000 feet - taxi-out, takeoff roll, climb to 3,000 ft, approach from 3,000 ft, and taxi-in. ICAO standardises the time spent in each of these four modes:
- Taxi/idle: 26 minutes (combined taxi-out and taxi-in)
- Takeoff: 0.7 minutes
- Climb out: 2.2 minutes
- Approach: 4.0 minutes
For each mode, the engine has a specific fuel flow rate measured in kilograms per second.
Engines are tested and certified at these power settings, and the data sits in the ICAO Aircraft Engine Emissions Databank.
We pull the per-engine, per-mode fuel flow figures from this databank for every aircraft type on the platform.
LTO fuel burn for a single flight is therefore:
LTO fuel (kg) = Σ (mode duration in seconds × fuel flow per engine in kg/s × number of engines)
For each of the four modes, fuel flow is multiplied by mode duration and by engine count, then summed. Multiply that fuel figure by 3.16 kg CO₂ per kg of jet fuel burned, and you have LTO CO₂.
The 3.16 emission factor comes from the stoichiometry of jet fuel combustion.
Jet-A1 is roughly 86% carbon by mass, and burning one kilogram of it produces around 3.16 kilograms of CO₂.
This is a fixed industry constant used by IPCC, ICAO, and EUROCONTROL alike.
Phase 2: The Cruise Phase
Cruise is everything above 3,000 ft. The long, fuel-efficient middle of the flight.
Per-second fuel burn drops dramatically once an aircraft is at altitude. A G650 at FL450 burns roughly half what it does on the climb out.
We model cruise as a flat hourly rate per aircraft type:
Cruise CO₂ = cruise hours × CO₂ per flight hour
The CO₂-per-hour figure is derived from manufacturer fuel burn data. Typically the "long range cruise" figure published in the Aircraft Flight Manual or in performance tables. This is then multiplied by 3.16.
Cruise hours are calculated as ADS-B-detected flight duration minus the LTO time already accounted for in Phase 1.
The Headline Formula
Pull it together and you get the formula on our methodology page:
Total CO₂ = LTO CO₂ + (Cruise Hours × CO₂ per flight hour)
Two terms. One for the noisy, fuel-hungry bit at each end. One for the long, steady middle. Add them together and that's the flight.
Worked Example: a Gulfstream G650 Flight from London to New York
Let's take a single Gulfstream G650 flight and trace it from the raw ADS-B receiver pings all the way through to a final published number.
Step 1: The Aircraft
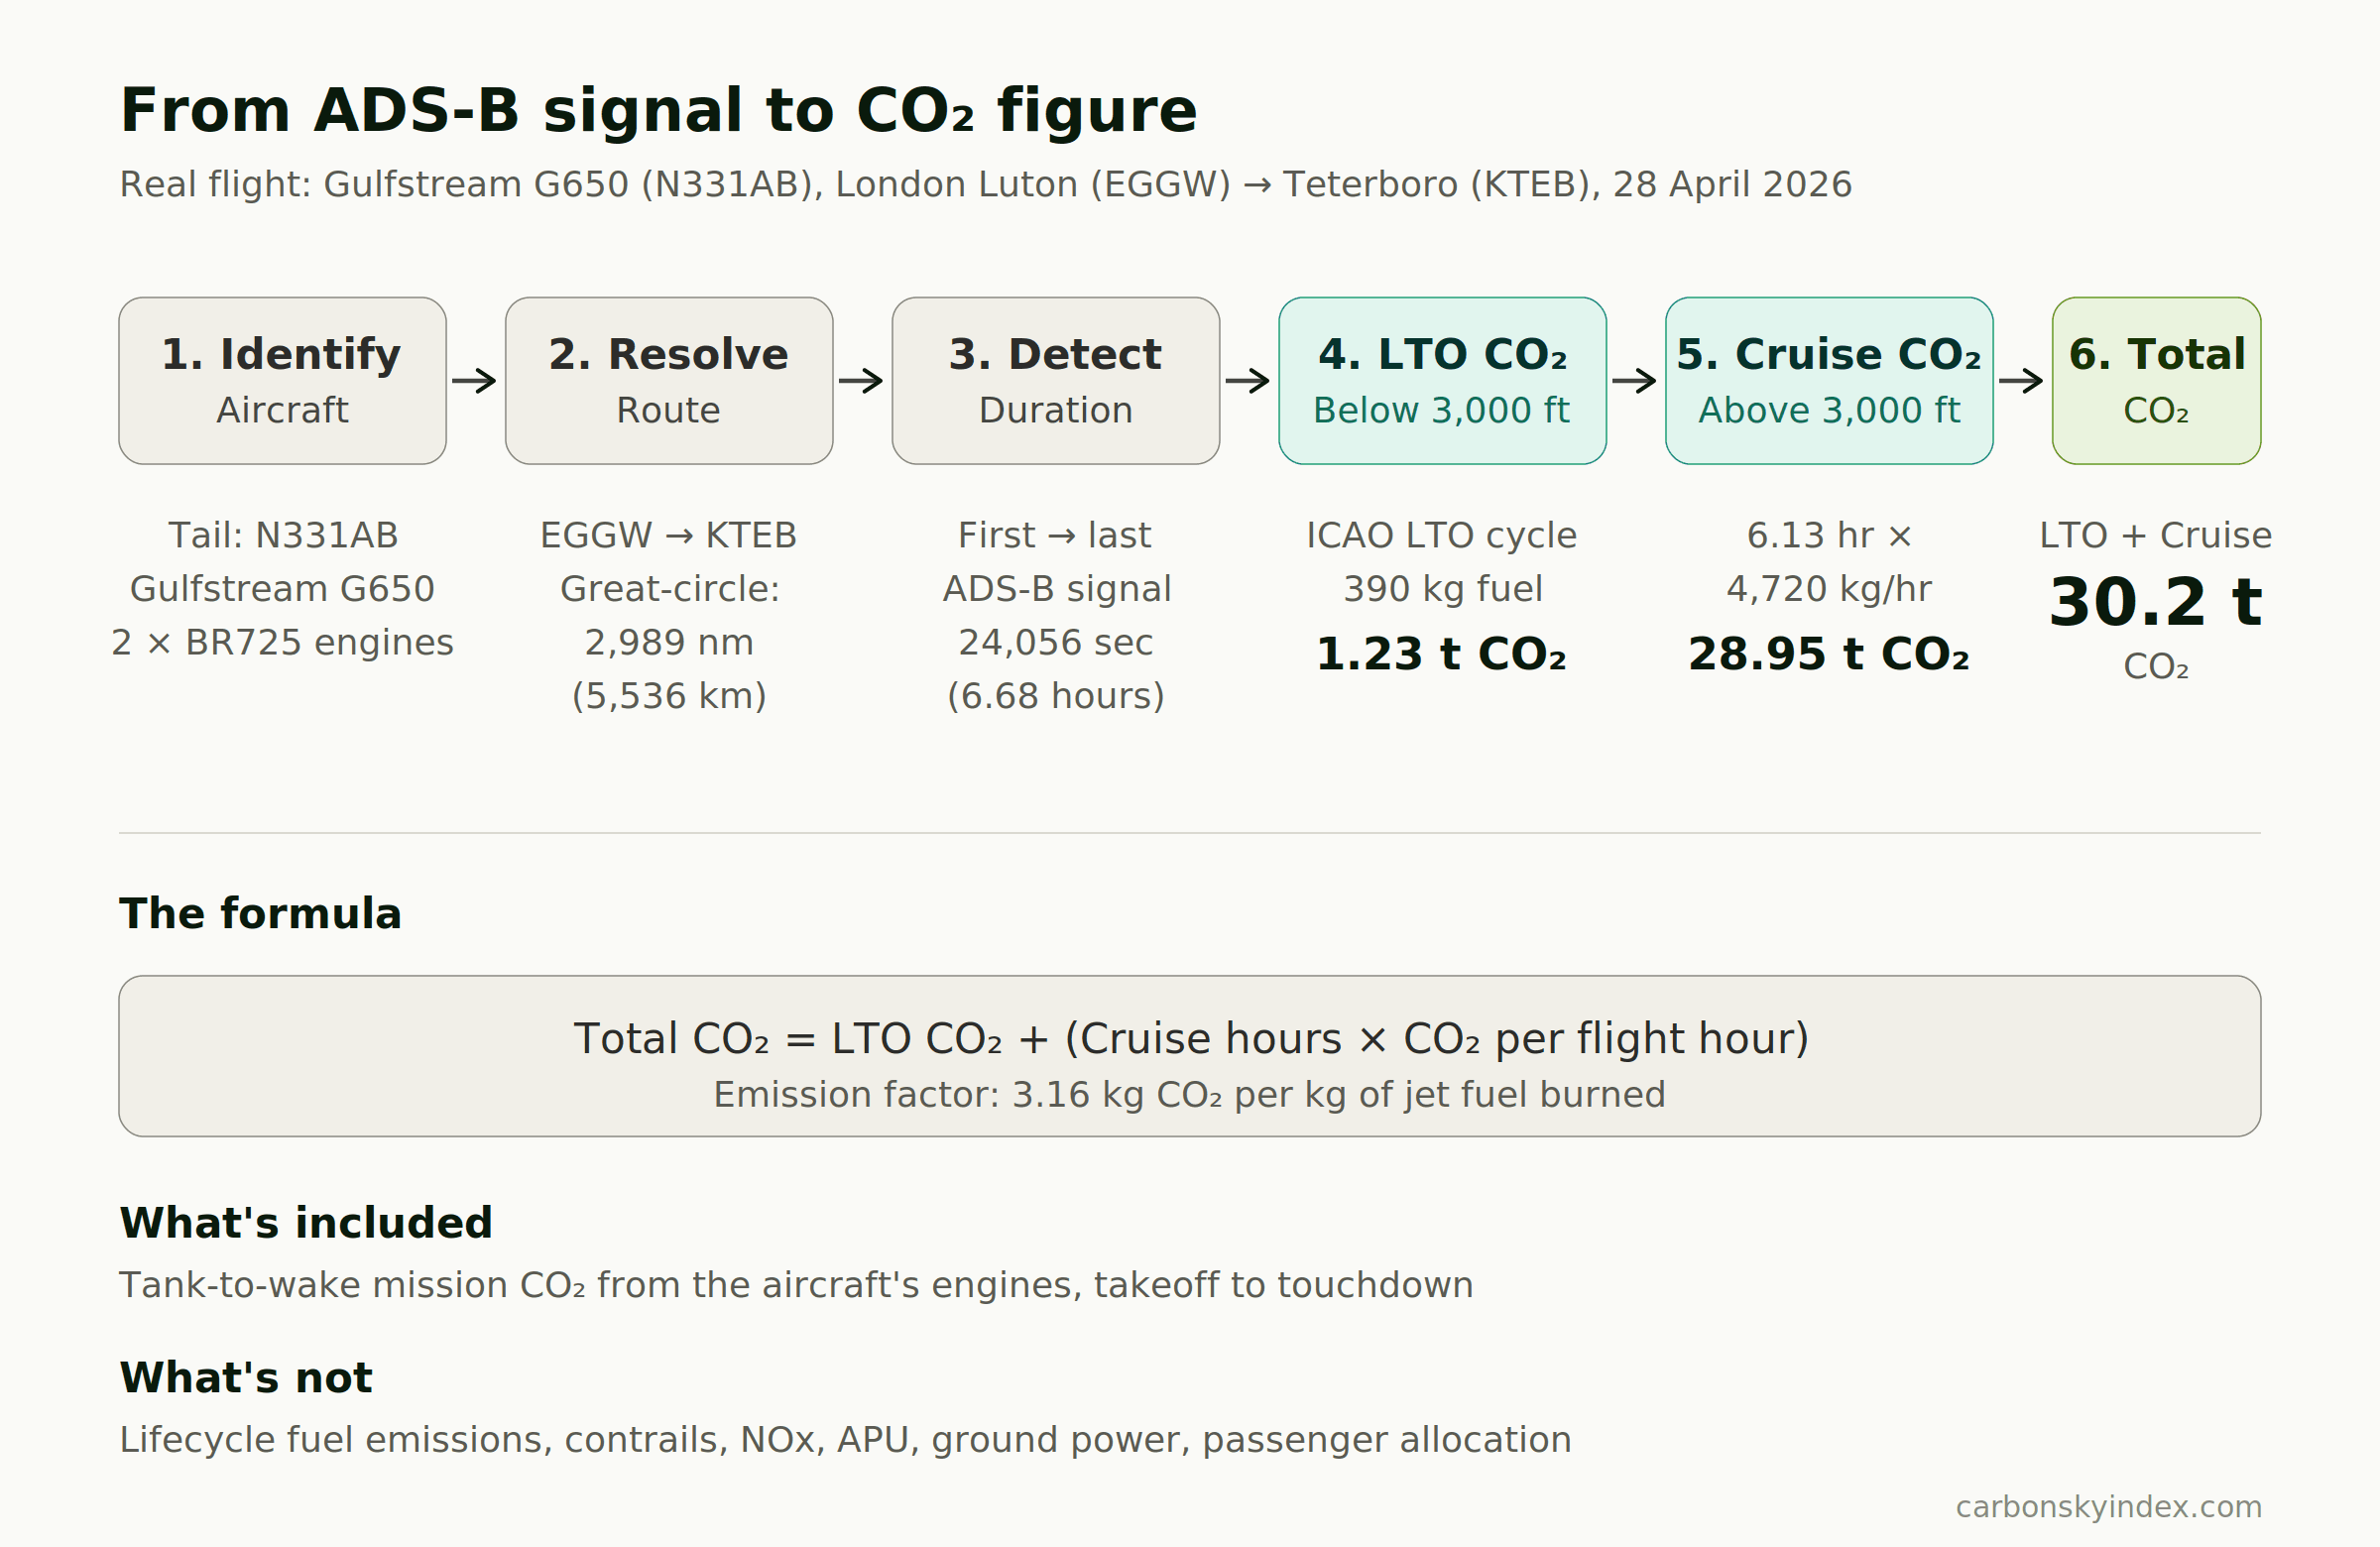
The flight we'll trace is a real one from our database: aircraft N331AB, a Gulfstream G650, departing London Luton (EGGW) for Teterboro (KTEB) on 28 April 2026.
Our ADS-B pipeline picks up the aircraft's Mode-S transponder code, cross-references it to the tail number in our registry, and resolves the airframe to:
- Type: Gulfstream G650
- Engines: 2 × Rolls-Royce BR725 (BR700-725A1-12)
- Cruise fuel burn: derived from manufacturer fuel burn data. Gulfstream technical documentation puts a G650 at Mach 0.85 and FL470 at around 1,100 kg/hr at low cruise weight, but operational reality on a fully-fuelled westbound transatlantic is materially higher. We use a per-aircraft cruise CO₂ rate calibrated to typical operating conditions for the type.
- LTO fuel flow per engine: taken from the ICAO Aircraft Engine Emissions Databank entry for the BR725, which holds certified per-engine fuel flow rates at the four standard ICAO power settings (7% thrust idle/taxi, 30% approach, 85% climb, 100% takeoff)
These figures are loaded once per aircraft type and then reused for every flight that aircraft makes. We don't need to re-derive them per flight.
Step 2: The Route
ADS-B detection gives us the origin (EGGW) and destination (KTEB). We resolve both to their ICAO coordinates:
- EGGW: 51.8747° N, 0.3683° W
- KTEB: 40.8501° N, 74.0608° W
Great-circle distance between these two points is 2,989 nautical miles (5,536 km).
This is the straight-line, shortest-path distance over the surface of a spherical Earth.
It is not the actual distance flown.
Real flights take longer routes. Vectoring around weather, following published air traffic routes, taking advantage of jet streams. Real-world flown distance on a transatlantic crossing is typically 3–8% longer than great-circle.
We deliberately use great-circle as our distance figure because it represents the minimum plausible distance flown.
This means our number is a conservative floor, not an inflated ceiling. If we're wrong, we're wrong on the low side.
Step 3: The Duration
Our ADS-B receiver network logs the first signal from N331AB on departure climb out of Luton, and the last signal on approach into Teterboro.
Total time between first and last signal:
24,056 seconds = 6 hours, 40 minutes 56 seconds = 6.682 hours
A note on accuracy: ADS-B duration may include some taxi time at either end if the aircraft was already transmitting before takeoff or after landing. It can also be cut short by signal gaps over the mid-Atlantic where ground-based receivers don't reach.
We accept these as known sources of noise and don't try to "correct" the duration with assumed taxi times - we use what the signal gives us.
Step 4: The LTO Calculation
The ICAO LTO cycle defines four modes with fixed durations and fixed engine power settings:
- Taxi/idle - 26 minutes (combined) - 7% power
- Takeoff - 0.7 minutes - 100% power
- Climb out - 2.2 minutes - 85% power
- Approach - 4.0 minutes - 30% power
For each mode, fuel flow per engine at that power setting is read from the ICAO databank entry for the BR725, multiplied by mode duration in seconds, and multiplied by engine count (2 for the G650).
Sum the four modes and you have total LTO fuel burn for the flight.
For the BR725-powered G650, the EUROCONTROL EMEP/EEA Guidebook 2023 methodology yields total LTO cycle fuel consumption of approximately 390 kg of fuel for the full cycle (both engines, all four modes combined).
Convert to CO₂:
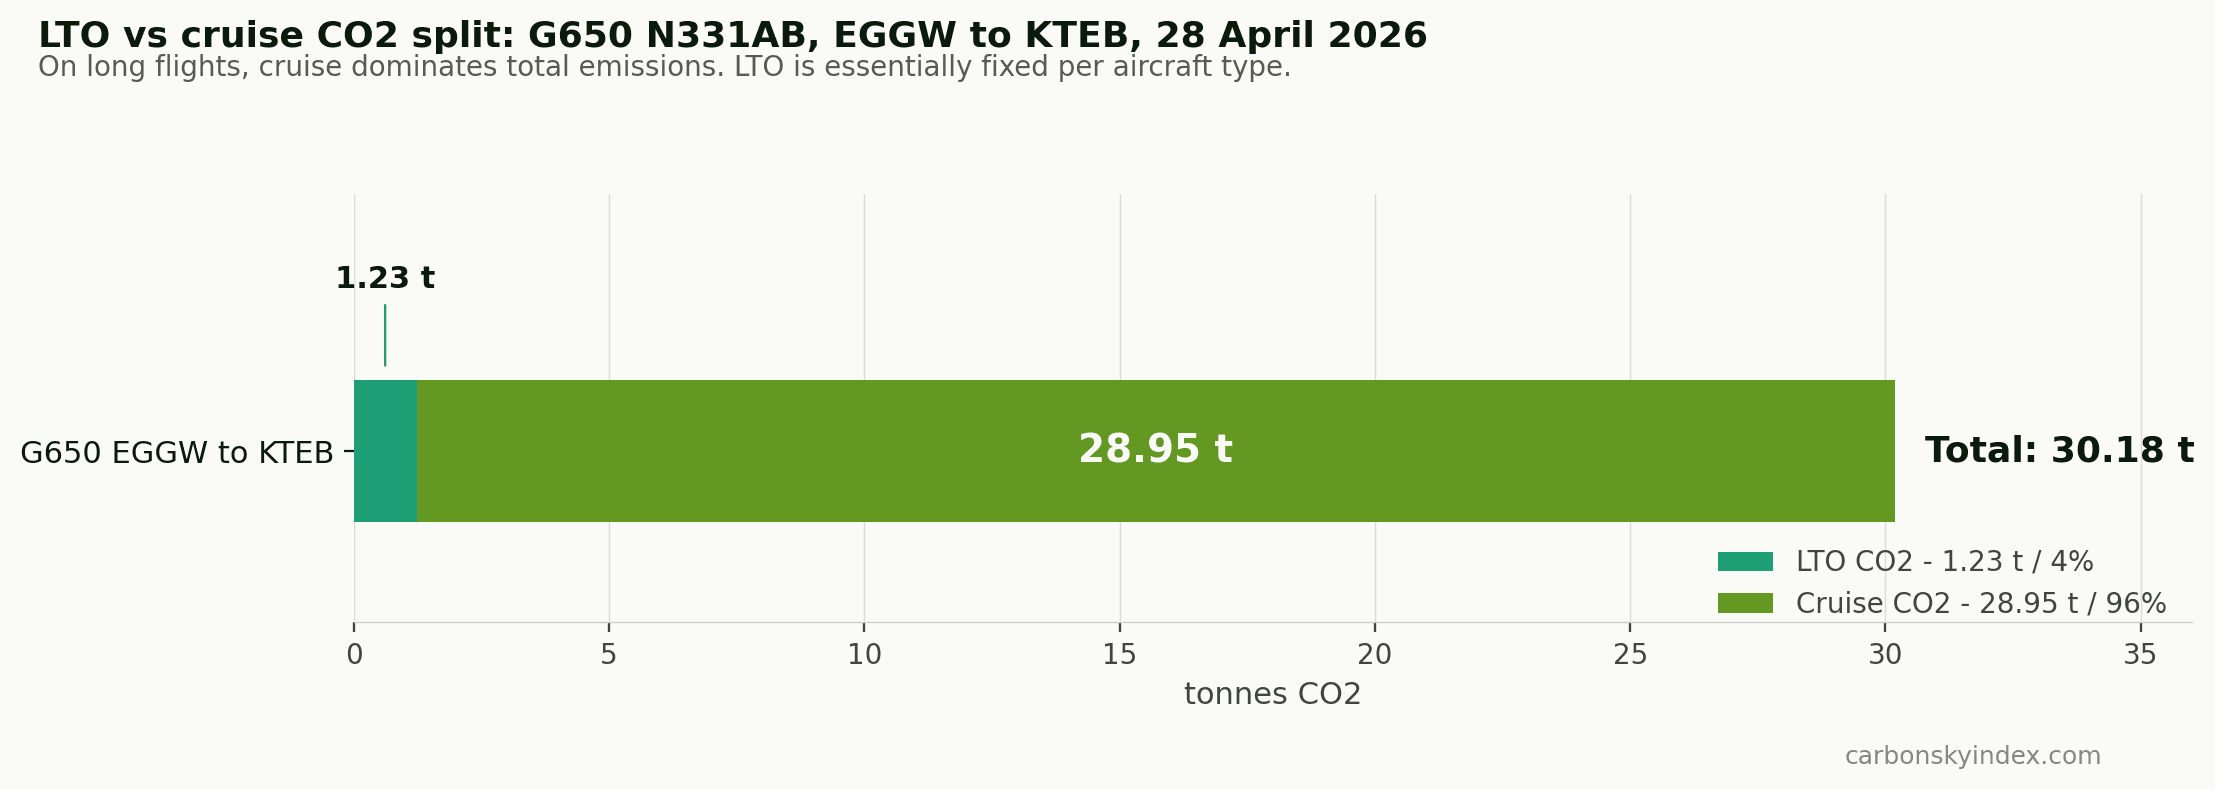
LTO CO₂ = 390 kg fuel × 3.16 = 1,232 kg CO₂ ≈ 1.23 tonnes
This figure is essentially fixed per aircraft type. Every G650 flight on the platform gets the same LTO emissions, because the LTO cycle is standardised. What varies between flights is the cruise component.
Step 5: The Cruise Calculation
The four LTO modes account for 32.9 minutes (0.548 hours) of total flight time.
Cruise hours are therefore:
Cruise hours = 6.682 - 0.548 = 6.134 hours
For the G650, our per-aircraft cruise CO₂ rate works out to approximately 4,720 kg per cruise hour - equivalent to ~1,494 kg of fuel burned per hour at the 3.16 emission factor.
This figure is calibrated for representative operational conditions on the type rather than the optimal-altitude, lightweight figure quoted in marketing materials.
A heavy westbound transatlantic with full fuel and reserves burns notably more per hour than a G650 at end-of-cruise weight cruising at FL510.
Cruise CO₂:
Cruise CO₂ = 6.134 hours × 4,720 kg/hr = 28,952 kg CO₂ ≈ 28.95 tonnes
Step 6: The Total
Total CO₂ = LTO CO₂ + Cruise CO₂
= 1.23 tonnes + 28.95 tonnes
= 30.18 tonnes CO₂
That's the published figure.
Approximately 30.2 tonnes of mission CO₂ for one G650 transatlantic crossing from London Luton to Teterboro on 28 April 2026.
A useful sanity check: a G650 operator publicly quoted ~16,000 lb (~7,260 kg) of fuel for a Teterboro–Le Bourget transatlantic at Mach 0.85 - a similar-distance route in the opposite direction.
7,260 kg × 3.16 = ~22.9 tonnes of CO₂ for the eastbound crossing.
Our westbound figure of 30.2 tonnes is materially higher, which is exactly what you'd expect: westbound transatlantic flights face headwinds rather than tailwinds, take longer, and burn more fuel per mile.
Different direction, different answer, and the directional asymmetry is itself a feature of the method, not a bug.
What That Figure Represents And What It Doesn't
It represents:
- Tank-to-wake CO₂ from the aircraft's two engines, between takeoff and landing
- Calculated from manufacturer-published fuel burn data
- Using actual ADS-B-detected flight duration
- Anchored to great-circle distance between the two airports
It does not represent:
- Upstream lifecycle emissions from extracting, refining, and transporting the fuel
- Auxiliary Power Unit (APU) burn on the ground before pushback
- Reserve fuel that was loaded but not burned
- Non-CO₂ effects: NOx, water vapour, contrails, soot
- Per-passenger allocation - the figure is the whole flight, not divided across occupants
- Ground operations such as towing, ground power, catering logistics
Every one of these is a legitimate thing to measure. We just don't measure them in this number.
What Other Trackers and Calculators Do Differently
This is where reasonable people make different methodological choices.
Understanding the differences is essential if you're comparing figures across sources.
Lifecycle ("well-to-wake") Vs Tank-to-Wake
Some calculators publish lifecycle emissions, often called well-to-wake or WTW.
This includes everything from extracting crude oil out of the ground, transporting it, refining it into Jet-A1, distributing it to airports, and finally burning it.
Lifecycle multipliers typically add 15–25% on top of tank-to-wake.
A G650 transatlantic flight that we publish at ~30.2 tonnes tank-to-wake might be ~36–38 tonnes well-to-wake.
Both are real.
They answer different questions. Tank-to-wake answers "what came out of this aircraft's engines?"
Well-to-wake answers "what was the total atmospheric carbon cost of this flight including supply chain?"
We publish tank-to-wake because it isolates the part of the flight attributable to the aircraft and its operation.
The part that's directly comparable across flights and aircraft types without dragging in fuel-supply variables.
Contrails and Non-CO₂ Radiative Forcing
Aviation's climate impact isn't only CO₂.
Contrails, water vapour, and NOx at altitude trap heat in ways that are scientifically real but mechanistically different from CO₂'s long-term atmospheric warming.
Some calculators apply a "radiative forcing multiplier" - typically 1.7× to 3× - on top of the CO₂ figure to capture total climate impact.
We don't for two key reasons.
First, the science on the appropriate multiplier is genuinely unsettled, and applying a wrong multiplier introduces more error than leaving it out.
Second, mixing CO₂-equivalent units with raw CO₂ across data sources creates apples-to-oranges comparisons. If you want to apply a multiplier to our figures for a specific analysis, you can. We just don't include one.
Passenger Load Factor
Commercial aviation calculators often divide flight emissions across an assumed number of passengers using a "per passenger" CO₂ figure. This makes sense when you're comparing modes of transport.
It makes less sense for private aviation, where occupancy is highly variable, often confidential, and frequently very low.
A G650 might leave London with eight passengers, two passengers, or zero passengers on a re-positioning leg.
We publish the whole-flight figure and let analysts decide if and how to allocate.
Block Time Vs ADS-B Time
Some emissions estimators use scheduled "block time". This is the time from gate departure to gate arrival.
This is fine for airlines, where schedules are public and reasonably accurate. Private aviation doesn't work that way. There's no schedule. There's just a flight.
We use ADS-B-detected duration.
It's the cleanest signal available for non-scheduled traffic, and it directly reflects when the aircraft was airborne and transmitting.
Fixed Averages Vs Aircraft-Specific Data
A surprising number of public calculators use a fixed CO₂-per-hour figure for "private jets" as a category.
Sometimes just a single number applied to everything from a Citation Mustang to a Global 7500.
The fuel burn difference between those two aircraft is roughly 6×.
Our methodology resolves to the specific aircraft type and applies its specific fuel burn profile.
This matters enormously for accuracy when comparing fleets, operators, or routes.
Limitations and Known Sources of Error
We are open about what the model gets wrong. Anyone publishing emissions data without acknowledging uncertainty is overselling.
Great-circle distance underestimates flown distance
Real flights deviate around weather, follow published airways, and use jet streams. Actual flown distance is typically 3–8% longer than great-circle on long flights. This means our cruise hours may very slightly underestimate true cruise hours. We accept this in exchange for using ADS-B duration directly.
ADS-B duration may include taxi time
If an aircraft is transmitting before brake release, our duration captures some idle/taxi time as if it were cruise. The error is small for long flights and proportionally larger for short ones. We don't correct for it because the correction would require assumptions we'd rather not make.
LTO fuel flow uses ICAO default cycle values
Real-world taxi times at busy airports can be much longer than 26 minutes, and much shorter at quiet ones. We use the standard ICAO cycle for consistency across the platform. Airport-specific taxi delays would require integrating ground movement data we don't currently hold.
Cruise burn is modelled linearly
We use a single per-hour cruise fuel burn rate per aircraft type. In reality, fuel burn changes with altitude, payload, headwind, and cruise stage (early cruise is heavier, late cruise is lighter). The error is typically within ±5% across a long flight but can be larger on short legs.
Signal gaps and detection edge cases
ADS-B coverage is excellent over land in Europe, North America, and most populated regions. It's patchy mid-ocean. We've built our pipeline to handle signal gaps without inventing data — we use only the duration we can observe — but on rare occasions a flight may be detected only partially. We flag these where we can.
Taken together, our published figures are best understood as directional, conservative estimates of mission CO₂ - accurate to within roughly ±10% on most flights, biased slightly to the low side because of the great-circle assumption.
Why We Publish This
The strongest argument for transparent methodology is that it's the only thing that makes the numbers useful.
A CO₂ figure that comes out of a black box is just a claim.
A CO₂ figure with a published method, an emission factor you can verify, a duration you can cross-check with other sources, and a worked example you can replicate is something a journalist can stand behind, an analyst can cite, and an operator can rebut on specifics if they think we've got something wrong.
We welcome corrections.
If you operate an aircraft on the platform and you have better fuel burn data than the manufacturer figures we're using, we want to hear from you.
If you spot a flight where our duration looks off, we want to know. The methodology gets stronger when it's challenged.
In summary
To answer the question in the title "how is private jet CO₂ calculated?", here's the short version:
- Identify the aircraft from its tail number, and load its specific engine and fuel burn profile.
- Resolve the origin and destination airports to coordinates.
- Take the flight duration directly from ADS-B detection.
- Calculate LTO emissions using the ICAO standard cycle and per-engine fuel flow rates.
- Calculate cruise emissions as cruise hours × manufacturer cruise fuel burn × 3.16 kg CO₂/kg fuel.
- Add the two together. Publish the total.
That's it. No hidden multipliers. No assumed loads. No lifecycle.
Just the carbon dioxide that came out of the engines, calculated using a public, reproducible method drawn from the EUROCONTROL EMEP/EEA Guidebook.