How to Produce an Assurance-Ready Scope 3 Number for Chartered Business-Jet Travel


Companies know what their charter flights cost. Very few know what those flights actually emitted.
Scheduled airline bookings already contain much of the information needed to estimate emissions.
Chartered flights usually do not.
They reach finance systems as invoices, leaving spend as the only readily available proxy.
So charter almost always becomes a spend-based estimate: take the cost, apply a factor, book the result.
That approach is often sufficient for high-level reporting.
It becomes limiting once assurance enters the picture, because a spend-derived figure carries no route, no aircraft, and no physical basis to point to when an assurer asks how it was built.
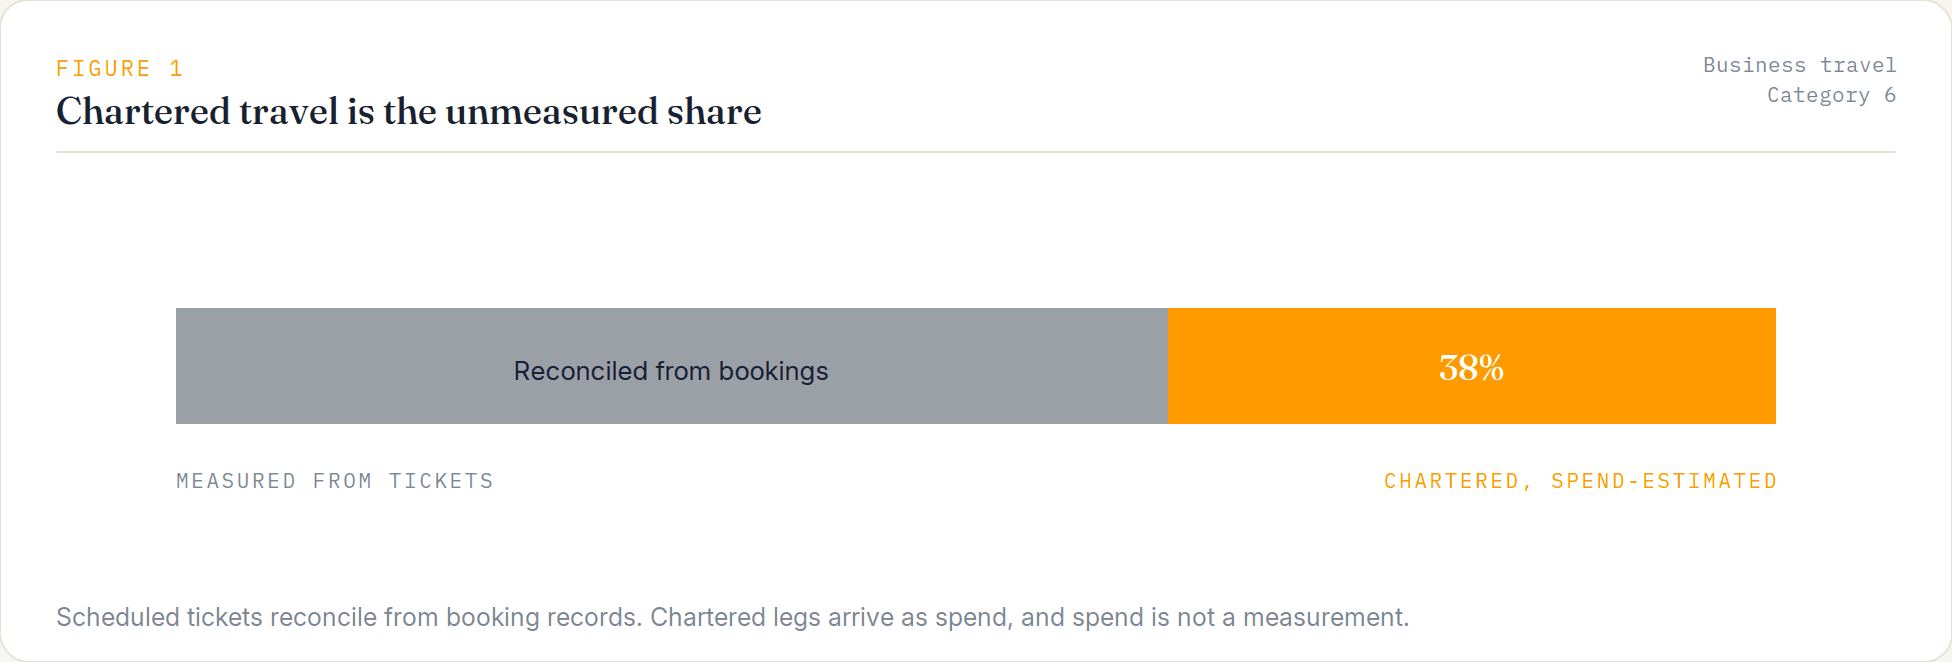
Figure 1: chartered flights as the unmeasured share of travel emissions. Lead image.
As assurance expectations increase, Category 6 business travel is becoming one of the areas reviewers examine more closely.
A measured figure answers the question a spend estimate leaves open: not what the trip cost, but what it emitted.
We are giving the whole method away on purpose. The steps were never the hard part. Assembling the flight data behind them is.
Why measured emissions carry more than a spend estimate
Spend-based accounting is a recognised approach, and in some contexts it is the appropriate one.
For chartered aviation, though, it discards most of the information that matters. Charter pricing reflects aircraft availability, positioning, and route, not fuel consumed, so two flights at the same price can differ sharply in emissions.
A measured method starts with the flight, not the invoice.
Starting there makes the number higher fidelity, physically grounded in a real route and aircraft, and traceable leg by leg, which is what makes it straightforward to evidence during assurance.
The reporting period, walked through
Anonymised and illustrative. Figures are internally consistent, to be replaced with your period's measured output.
We rebuilt one reporting quarter of an illustrative professional-services firm's chartered travel, flight by flight, against the single spend total it had logged.
What the flights actually were.
The quarter resolved into a set of measured flights, each with a real origin, destination, aircraft type, and modelled fuel consumption, rather than one blended figure.
Every leg carried its own emissions.
The size of the gap.
Measured emissions came out about 31% above the spend-based estimate.
Short repositioning legs, which spend factors under-weight, were a large part of the difference.
An exposure the spend estimate could not identify.
About 38% of the measured tonnage was on flights that departed or arrived in the EU or the UK, and therefore sat inside a trading scope.
That is not a cost the sustainability team owns, but it is a fact the report should carry.
What they issued. A per-flight statement, each line marked as measured or estimated, with the EU or UK trading touch flagged per leg, and a coverage note stating how much of the period was measured directly.
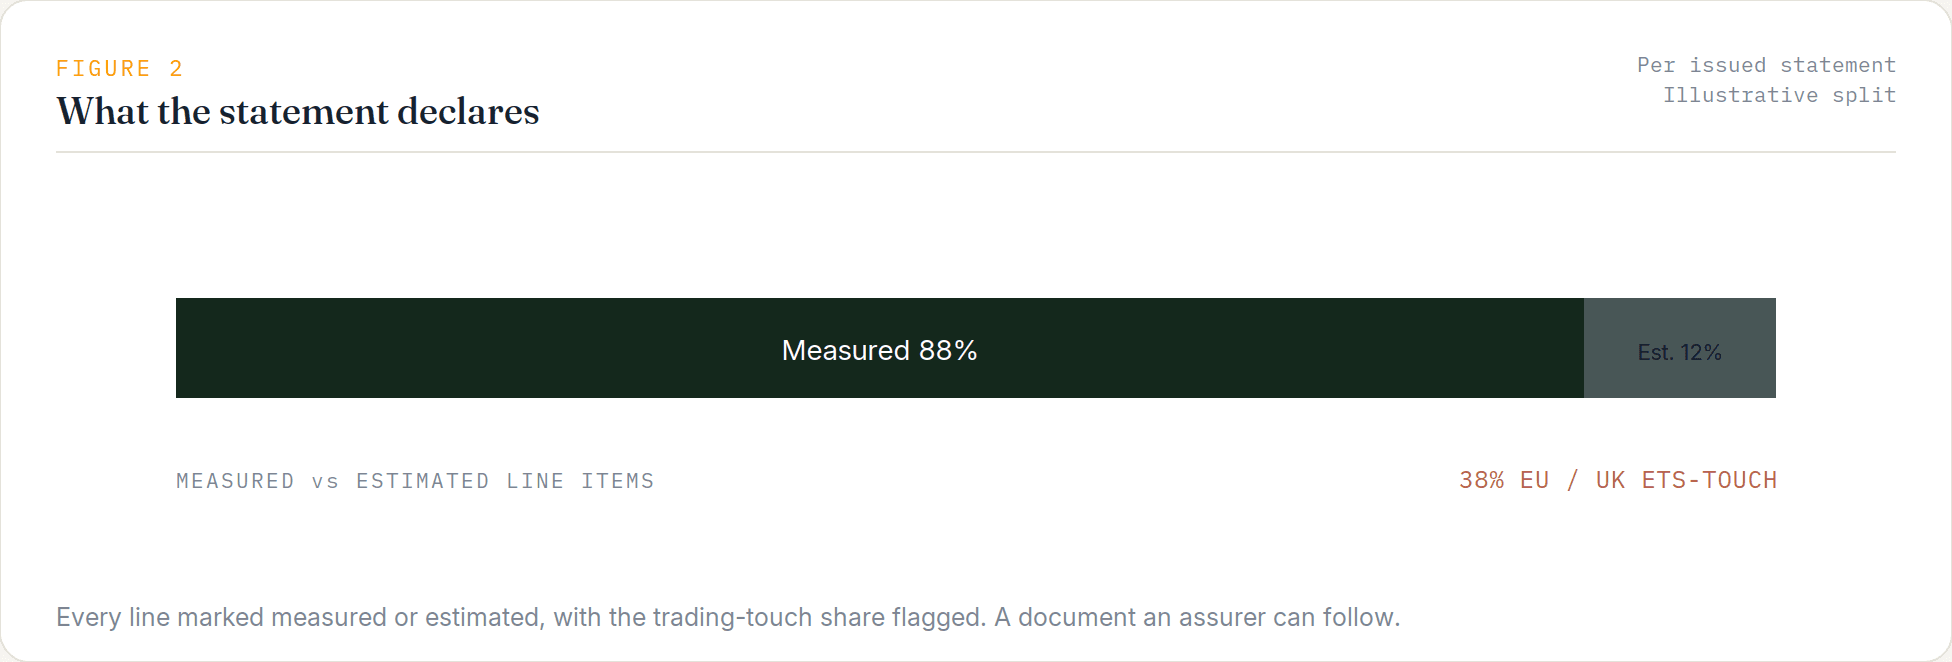
Figure 2: statement composition, measured vs estimated line items and the trading-touch share.
The method
None of these steps are unusual, and the methodology is public.
The challenge is not the equations.
It is reconstructing observed flight activity from fragmented charter records before those equations can be applied.
Emissions Statement reconstructs: it reconstructs the measured inputs from observed flight activity and produces the reporting statement, without the sustainability team building the data pipeline itself.
Flight activity comes from ADS-B.
Each observed flight provides an origin, destination, date, and duration.
Emissions are computed with the published EUROCONTROL EMEP/EEA 2023 methodology, with fixed conversions and no smoothing or interpolation.
Where a leg cannot be matched to observed activity, it is carried as an explicit estimate rather than blended in silently, so the measured and estimated portions stay separable on the page.
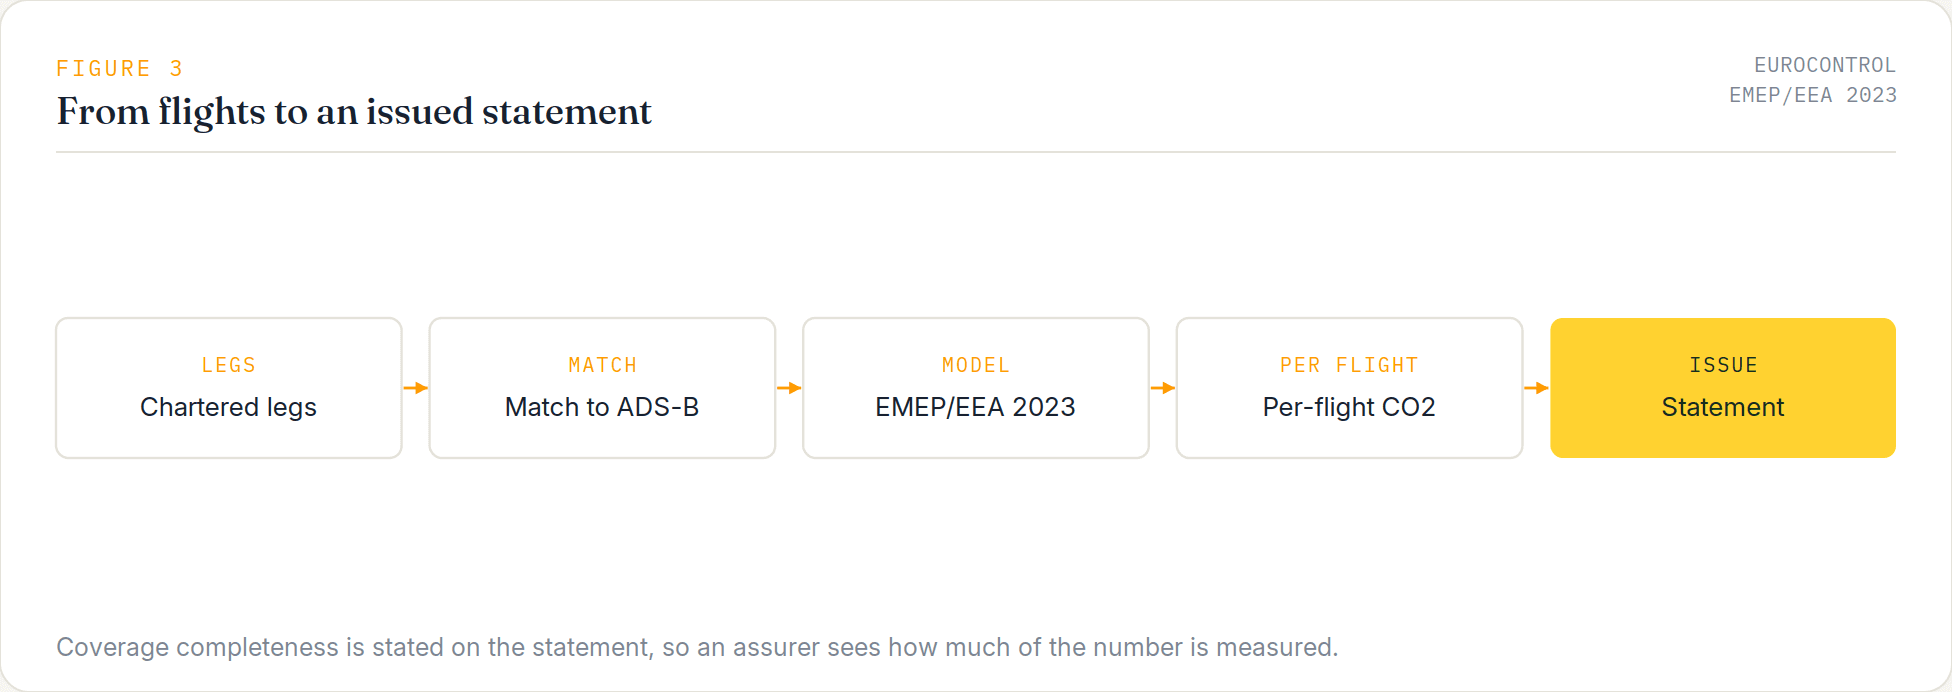
Figure 3: from flights to an issued statement. ADS-B, EMEP/EEA 2023, per-flight CO2, line items, coverage note.
Why coverage completeness matters
Most emissions reports present a single number, with no indication of how much comes from observed activity and how much from estimation.
The statement reports coverage completeness explicitly, so an assurer can see what proportion of the total is directly measured. Interpretation of the total depends on it.
Statement contents
- Per-flight CO2
- Aircraft model
- Origin and destination
- Measured or estimated status
- EU or UK ETS touch flag
- Coverage completeness
- Methodology reference
A spend line records what a trip cost. A Scope 3 number should record what it emitted.
The steps
Step 1: List the period's chartered and fractional flights. Start from travel that did not reconcile through airline bookings, the flights that would otherwise be represented only by a spend estimate.
Output: the set of flights in scope for the period.
Step 2: Match each flight to observed activity. Resolve each leg to a real route and aircraft type. Legs that cannot be matched are held as explicit estimates.
Output: measured legs, plus a clearly separated estimated remainder.
Step 3: Compute per-flight emissions. Apply the methodology to each leg. Keep the legs separate rather than blending, so the statement is traceable line by line.
Output: CO2 per flight, and the period total.
Step 4: Flag regulatory touch. Mark each leg that departs or arrives in the EU or UK trading scope, so the report carries the exposure rather than discovering it later.
Output: the trading-touch share of the period.
Step 5: Issue the statement. Produce the per-flight document with measured and estimated legs marked, the trading touch flagged, and coverage completeness stated.
Output: a statement built for assurance.
What this cannot tell you
Being explicit about the limits is what makes the rest defensible.
It reports emissions at flight and route level. It does not name who else was aboard, and it does not invent fields to fill a gap.
Where a leg cannot be measured, it is shown as an estimate rather than dressed up as measured. And it is a measurement input to your report, not the report itself.
Those constraints are what make the statement usable during independent assurance.
One application of many
A measured Scope 3 Category 6 number is one use of the same flight record.
The trailing activity behind it also supports year-on-year travel-emissions tracking and route-level reduction analysis, the inputs that make a reduction target credible rather than aspirational.
Your finance system already records what charter travel cost.
Your sustainability report needs to know what was actually flown.
The same measured flight activity can support reporting, assurance, year-on-year tracking and reduction planning. Scope 3 reporting is simply where many organisations first encounter the problem.
Produce a measured Scope 3 Category 6 statement for your last reporting period.