JetNet Alternatives: Which Platforms Actually Show Flight History and Emissions Data?

JetNet has been the default reference point in private aviation intelligence for decades.
It is robust, well-sourced, and widely accepted as the institutional standard for ownership records and transaction history.
That reputation is deserved.
But the landscape has changed, and the diligence questions being asked in 2026 have changed with it.
ESG disclosure requirements, ICAO CORSIA obligations, and the growing integration of sustainability considerations into aviation finance mean that a platform's ability to surface emissions data has moved from "nice to have" to a genuine underwriting consideration.
Lenders and lessors are increasingly being asked to demonstrate that they have reviewed Scope 3 emissions exposure on assets they are financing.
Brokers are being asked the same by institutional buyers.
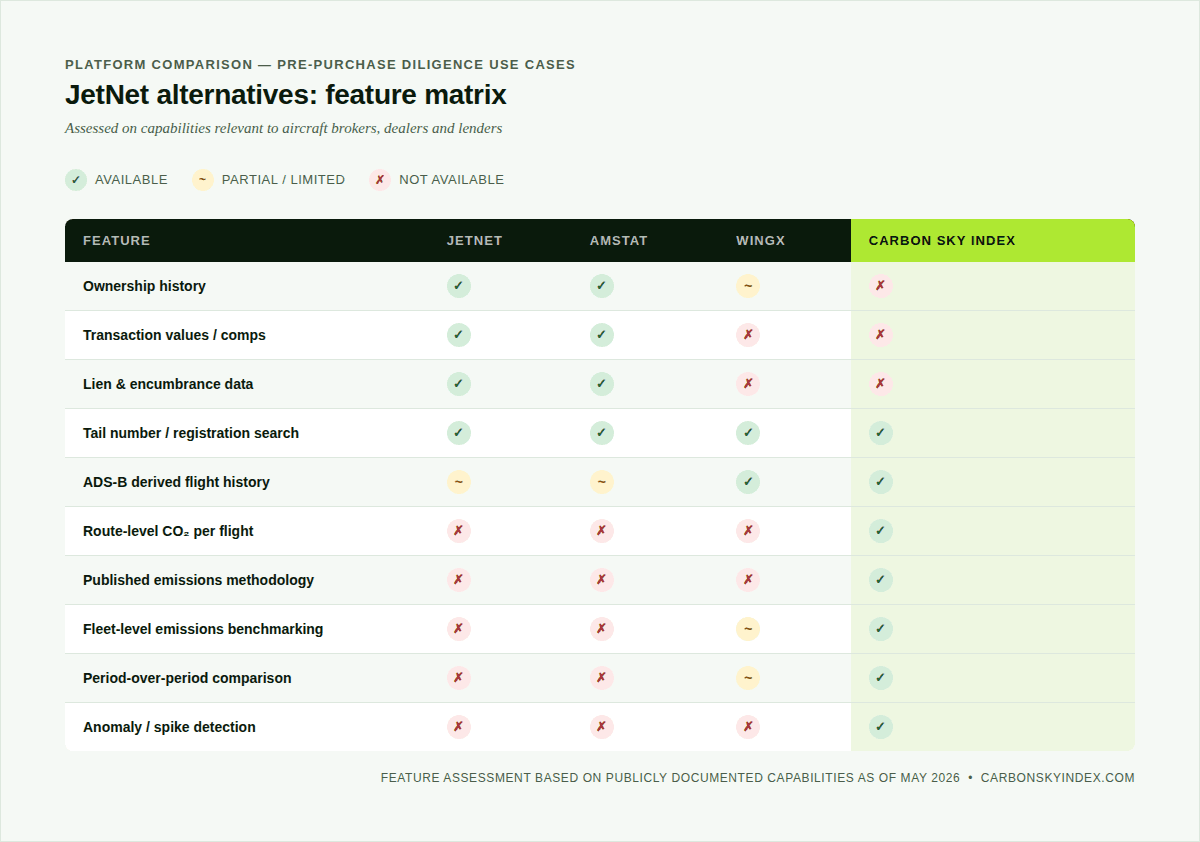
This piece runs through the main JetNet alternatives and assesses each one on the dimensions that matter most in a pre-purchase or financing context: flight history depth, tail number search capability, ownership data quality, and emissions intelligence.
What Pre-Purchase Diligence Actually Requires
Before comparing platforms, it is worth being precise about what pre-purchase diligence actually demands from a data source.
The questions are not all the same type.
Ownership and transaction history is the established core of any diligence process. You need to know who has owned the aircraft, when it changed hands, whether there are liens or encumbrances, and what the transaction values look like. This is where JetNet and AMSTAT have historically been strongest.
Flight history and utilisation is a harder problem. An aircraft's hours logged in a logbook tell one story. What it has actually flown, when, and to where tells another. Discrepancies between the two are not uncommon and can be material to a valuation. ADS-B derived flight data is now the most granular way to verify utilisation claims.
Emissions profile is the newest dimension and the one most platforms handle worst. For a lender doing Scope 3 accounting under GRI or CSRD frameworks, knowing the CO₂ per flight for a given aircraft type on given routes is no longer an optional calculation. For a buyer assessing long-term asset risk, understanding how a specific tail's emissions profile compares to its category peers is a legitimate valuation input.
The question is not just whether a platform has data. It is whether the data is granular enough, recent enough, and methodology-documented enough to be cited in an actual ESG disclosure.
The Main Platforms Compared
The market for private jet database comparison is not large.
There are four platforms that come up consistently in professional contexts: JetNet, AMSTAT, WINGX, and Carbon Sky Index.
There are also a handful of lighter tools used mainly by journalists or enthusiasts.
The comparison below focuses on the four platforms relevant to institutional users.
JetNet: Still the Benchmark for Ownership Data
JetNet's strength is ownership and transaction data.
For a broker or lender who needs to know the full title chain on a specific registration, understand current market values for comparable transactions, or identify any liens prior to close, JetNet remains the most complete source.
Its data on North American and European fleets is particularly deep.
The aircraft ownership data is sourced from aviation authorities and supplemented by transactional records, and for most institutional diligence purposes it is sufficient.
Where JetNet falls short is on the operational side.
Flight history in JetNet is primarily derived from reported hours and airframe records rather than ADS-B tracking.
This means that utilisation data can lag, and there is no granular route-level view of where an aircraft has been flying and how frequently.
For a buyer trying to stress-test a seller's utilisation claims against independent data, this is a real gap.
On emissions, JetNet is extremely limited.
This is not a criticism exclusive to JetNet; it applies equally to AMSTAT and most other tools in the JetNet vs AMSTAT comparison.
Emissions were simply not part of the product design when these platforms were built, and retrofitting them is not trivial because it requires both granular flight data and a defensible emissions methodology applied consistently across aircraft types.
AMSTAT: The Closest Comparable
AMSTAT's positioning overlaps heavily with JetNet's.
It covers ownership history, fleet statistics, transaction comps, and financing data.
For pre-purchase diligence on business jets and turboprops, the two platforms serve similar needs, and many professionals in the space subscribe to both or switch between them depending on the aircraft type or region.
AMSTAT's interface tends to be preferred for certain fleet analytics and for export workflows that feed into internal valuation models.
Its coverage of fractional ownership arrangements and charter operators is strong.
Like JetNet, it has little to no emissions capability, and its flight history is limited to reported rather than tracked data.
The practical answer to the JetNet vs AMSTAT question for most diligence teams is that the choice comes down to regional coverage, workflow integration, and pricing rather than any fundamental capability difference.
Neither platform was designed for the emissions or operational verification use cases that are growing in importance.
WINGX: The Flight Data Specialist
WINGX is the platform that most directly addresses the flight history gap.
It aggregates ADS-B data across the European business aviation market and produces market reports, airport statistics, and aircraft-level movement data.
For understanding how a specific tail has actually been used in European airspace, WINGX is more useful than either JetNet or AMSTAT.
WINGX's emissions coverage is more limited.
The platform produces aggregate market-level statistics on fuel burn and emissions, and some emissions data appears in its reports, but it is not designed for aircraft-level or owner-level emissions diligence.
The methodology behind its emissions figures is not publicly documented in the way that an ESG analyst or a lender's sustainability team would need to cite a figure in a disclosure.
WINGX's geographic focus is also a constraint. Its strength is European market data.
For globally operating fleets or for North American assets, the coverage thins out.
It is also worth noting that WINGX was purchased by JetNet in June 2023.
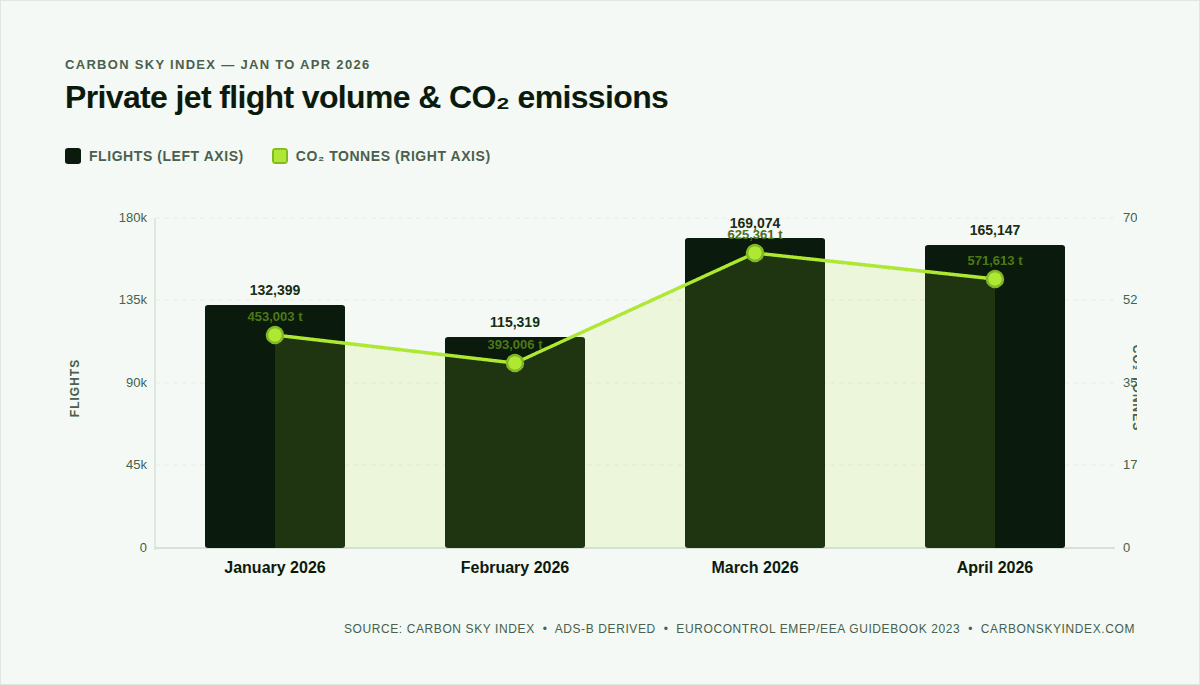
The chart above illustrates one of the core data products that the legacy platforms cannot produce: a monthly view of actual flight activity and associated CO₂ across the tracked fleet, derived from ADS-B data and calculated per flight using a published methodology.
March 2026 was the highest-volume month in the period, with 169,074 flights generating 625,361 tonnes of CO₂. That kind of granularity is not available from any ownership-focused platform.
The Emissions Data Gap: Why It Matters Now
It is worth being specific about why the absence of emissions data in the legacy platforms has become a practical problem rather than just a theoretical gap.
Under the EU Corporate Sustainability Reporting Directive (CSRD), large companies and financial institutions are now required to disclose Scope 3 emissions, which includes financed emissions from assets on a lender's balance sheet.
An aircraft on a lessor's fleet is a financed emission.
For a lender or lessor subject to CSRD, being able to report the annual CO₂ output of a specific registration is not optional.
The problem is that calculating this correctly requires three things that none of the legacy platforms provide: granular route-level flight data, aircraft-type-specific fuel burn coefficients, and a documented calculation methodology that can be cited in a disclosure.
Without all three, any emissions figure is an estimate without an audit trail.
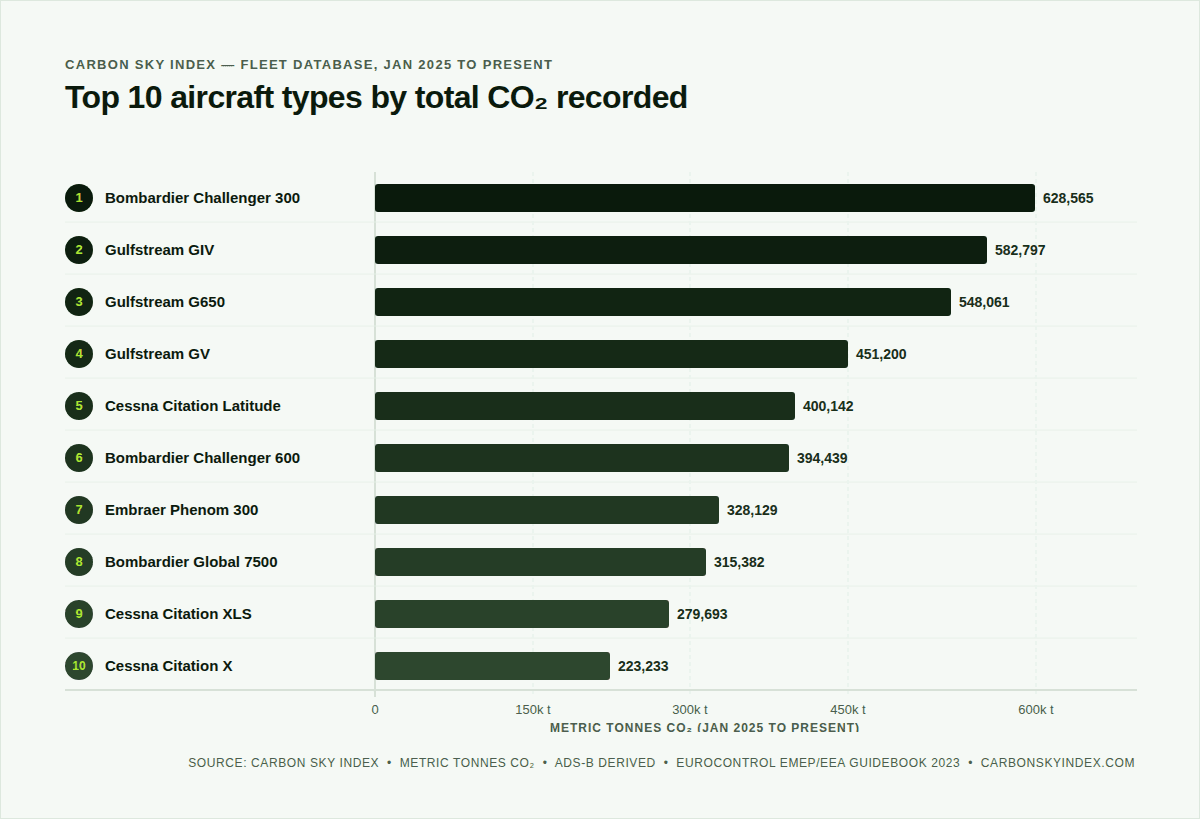
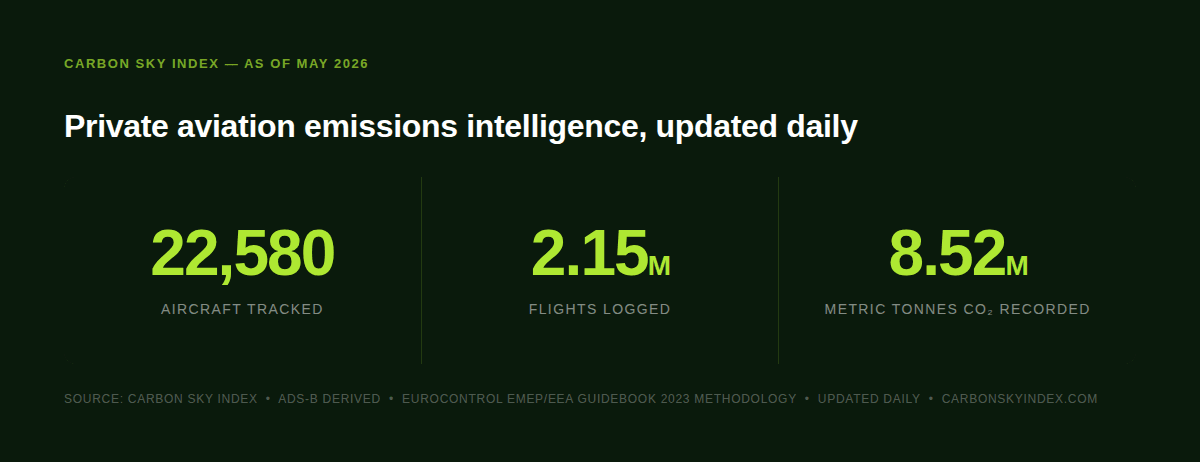
The data above is generated from Carbon Sky Index's live flight database, which tracks 22,580 aircraft using ADS-B data and calculates emissions per flight using the EUROCONTROL EMEP/EEA Guidebook 2023 LTO and cruise phase methodology.
The Bombardier Challenger 300 leads on aggregate CO₂ output largely because it is also one of the most frequently operated types in the dataset, with 162,570 tracked flights.
The Gulfstream GIV and G650, by contrast, generate comparable total emissions figures at significantly lower flight counts, reflecting their heavier per-flight fuel burn as long-range heavy jets.
This kind of aircraft-type-level breakdown is directly relevant to pre-purchase diligence.
A buyer evaluating a Gulfstream G650 against a Challenger 300 for a similar mission profile is making an implicitly significant decision about their Scope 3 exposure.
That decision should be informed by data.
Tail Number Search: The Verification Use Case
One of the most common diligence tasks is straightforward: look up a specific registration, verify its flight history against the seller's claims, and understand how it has been used.
All four platforms support tail number search at some level, but what you get back varies significantly.
JetNet and AMSTAT return ownership history, configuration data, and in some cases reported hours.
WINGX returns actual flight movements with dates, routes, and distances where the aircraft has been tracked.
Carbon Sky Index returns flight movements with calculated CO₂ per flight, total emissions over the tracked period, and benchmarking against aircraft category averages.
For a lender or broker whose due diligence requirements now include an emissions assessment, the tail number search in the legacy platforms returns an incomplete picture.
Ownership records are necessary but not sufficient if the question being asked includes emissions exposure.
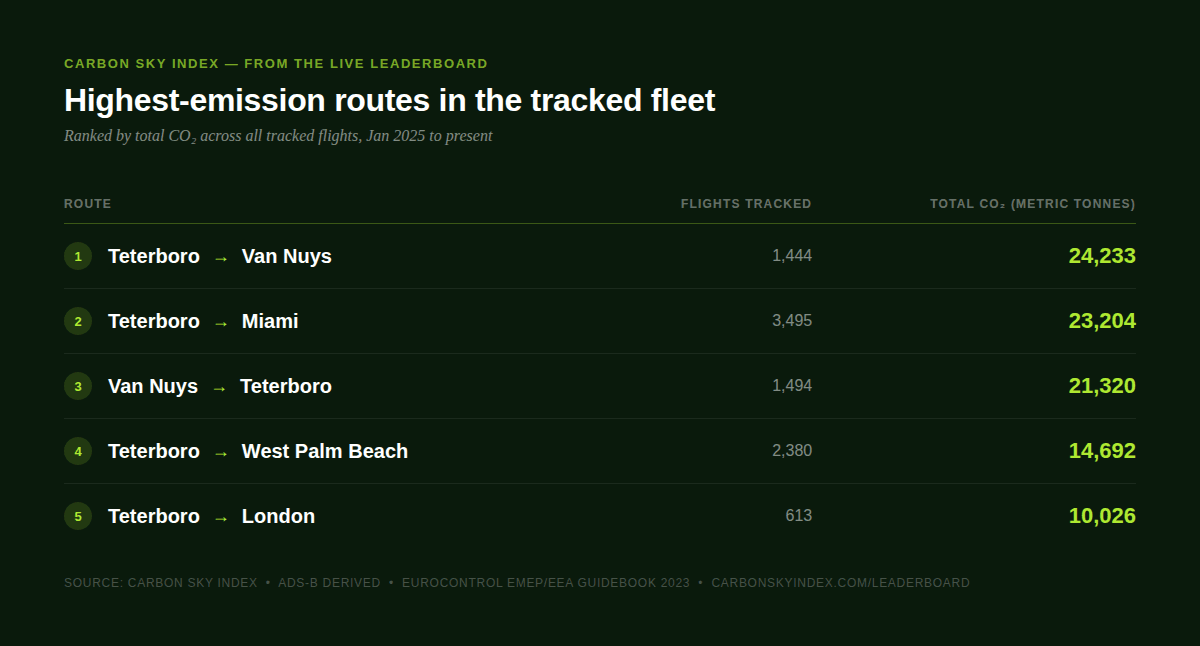
The route data above is taken directly from Carbon Sky Index's flight database. Teterboro (TEB) is the dominant origin for high-emission routes, reflecting its role as the primary business aviation gateway to the New York metro area.
The Teterboro to London route, despite a lower flight count than the domestic corridors, generates the highest per-flight emissions in the dataset, as expected for a transatlantic mission on a heavy or ultra-long-range type.
For brokers representing aircraft that regularly fly these routes, this data is both a diligence tool and a market context signal.
For lenders, it is the kind of fleet-level picture that Scope 3 accounting under CSRD requires.
Methodology: The Part Most Platforms Skip
One of the least discussed but most important differences between platforms is whether they publish and defend their emissions methodology.
For a figure to be citable in a regulatory disclosure or an ESG report, it needs a documented calculation basis.
A number without a methodology is not an auditable figure; it is a guess with confidence applied to it.
Carbon Sky Index calculates emissions using the EUROCONTROL EMEP/EEA Guidebook 2023 framework, applied across both the LTO (landing and take-off) and cruise phases of each flight.
Fuel burn coefficients are sourced from aircraft-type-specific engine data across 147 aircraft types.
The full methodology is publicly documented on the platform. No other platform in this comparison publishes an equivalent level of methodological transparency.
This matters because the audience for emissions data in an aviation diligence context is not just analysts running their own calculations.
It is compliance teams, auditors, and sustainability officers who need to know that the number they are putting into a disclosure can be defended if questioned.
A platform that produces emissions figures without a published methodology cannot serve that need.
The honest answer for most diligence teams is that these platforms are not substitutes for each other. They cover different parts of the problem.
If your primary need is title history, lien search, and transaction comps, JetNet or AMSTAT remains the right starting point.
That is what they were built for, and they do it well. If your need is operational verification of flight history using ADS-B data, WINGX adds significant value in European contexts.
If your need is emissions intelligence, including route-level CO₂, fleet benchmarking, and a methodology that can be cited in a regulatory disclosure, Carbon Sky Index is the only platform in this comparison that addresses it.
For a lender or institutional buyer running a full diligence process in 2026, the practical answer is a combination: a legacy platform for ownership and financial data, supplemented by emissions and operational data from a platform designed for it.
The two functions are complementary rather than competitive.
What CSI Adds to the Diligence Stack
Carbon Sky Index tracks 22,580 aircraft and has logged over 2.1 million flights since January 2025.
Every flight generates a CO₂ calculation based on the EUROCONTROL EMEP/EEA Guidebook 2023 methodology, applied across LTO and cruise phases for 147 aircraft types.
For pre-purchase diligence, CSI provides: ADS-B derived flight history for tail number verification, CO₂ per flight for route-level emissions assessment, fleet benchmarking against category peers, and period-over-period comparison for trend analysis.
Explore the live emissions leaderboard or review access options for diligence and ESG workflows.
What to Look for When Evaluating Any Platform
Whether you are evaluating the platforms in this article or others, there are a few questions worth asking before committing to any data source for a professional diligence process.
Is the data sourced or derived? Ownership data is typically sourced from aviation registries and title databases. Emissions data needs to be derived from actual flight data using a calculation model. Knowing which category a given platform's data falls into tells you a lot about its reliability and limitations.
Is the methodology documented? For any figure you are going to put into a report, a disclosure, or a presentation to a credit committee, you need to be able to explain where it came from. A platform that cannot answer this question clearly is a platform whose numbers you cannot defend.
What is the coverage date range and update frequency? Historical ownership records can be static. Flight data and emissions data need to be current. Any platform selling you a historical snapshot as a live dataset is worth scrutinising.
What is the geographic coverage? WINGX is strong in Europe. JetNet and AMSTAT are strongest in North America. For global fleet analysis, you need to understand where each platform's coverage thins out and plan accordingly.
The private aviation data market is still maturing.
The platforms that will be most useful to diligence professionals in the coming years are those that can combine the ownership depth of the legacy tools with the operational granularity and emissions intelligence that regulatory requirements now demand.
At the moment, no single platform does all of it.
Understanding which tool covers which part of the problem is the most practical starting point.