The Best Platforms for Tracking Private Jet Carbon Emissions
A rigorous comparison of the tools available for journalists, ESG analysts, and sustainability researchers
Private aviation emissions have moved from a niche research topic to a mainstream ESG concern.
Journalists are citing flight data in front-page stories. Asset managers are asking about portfolio exposure.
Corporate sustainability teams are trying to explain to boards why the CEO's charter use doesn't appear in scope 3 disclosures.
The data infrastructure to support all of this has developed quickly over the last few years but unevenly.
Some platforms are research tools built by academics. Some are media projects. Some are commercial aviation analytics tools that added an emissions layer as an afterthought. And a small number are purpose-built emissions intelligence platforms.
This article covers the main options, what they actually do well, and where they fall short for professional use cases.
What to Look For in a Private Jet Emissions Platform
Before comparing tools, it's worth being clear about what separates a useful platform from a noisy one.
Methodology transparency
Emissions figures can vary significantly depending on whether a platform accounts for load factor, aircraft weight class, flight phase (LTO vs cruise), or uses a flat per-kilometre multiplier.
A platform that publishes its methodology and is willing to defend it is fundamentally different from one that surfaces a number without explanation.
Data coverage
ADS-B data covers most of the civil aircraft fleet, but coverage has gaps. LADD (Limiting Aircraft Data Displayed) protections in the US allow some aircraft to be partially obscured. A platform's ability to handle this transparently matters.
Aircraft-level granularity
Fleet averages are useful for rough benchmarking. Aircraft-level data - by tail number, operator, and aircraft type - is what's needed for actual ESG analysis or due diligence.
Institutional usability
Is the data citable? Is there a methodology document? Can you export it in a format that drops into a report or financial model? For journalists, analysts, and lenders, these aren't nice-to-haves.
The Main Platforms
Carbon Sky Index
Carbon Sky Index is a private aviation emissions intelligence platform covering 22,000+ aircraft globally. It's built specifically for professional use with the primary audience being journalists, ESG analysts, sustainability researchers, and aviation finance teams rather than the general public.
The platform ingests ADS-B flight data and processes it through a published EUROCONTROL-derived methodology covering LTO (landing and takeoff) and cruise phases, with aircraft-type-specific fuel burn coefficients.
This is a meaningful distinction: most consumer-facing tools use simplified per-kilometre estimates that don't reflect the significant emissions difference between aircraft types.
A Gulfstream G650ER burns around 490 gallons of fuel per hour and generates roughly 10,535 lbs of CO₂.
A Bombardier Learjet 75 burns 199 gallons per hour and generates around 4,279 lbs.
The same route, very different footprint, and a flat distance-based model won't capture that.
Key features include:
- Aircraft-level emissions profiles with historical data from January 2025
- Route-level and airport-level emissions aggregates
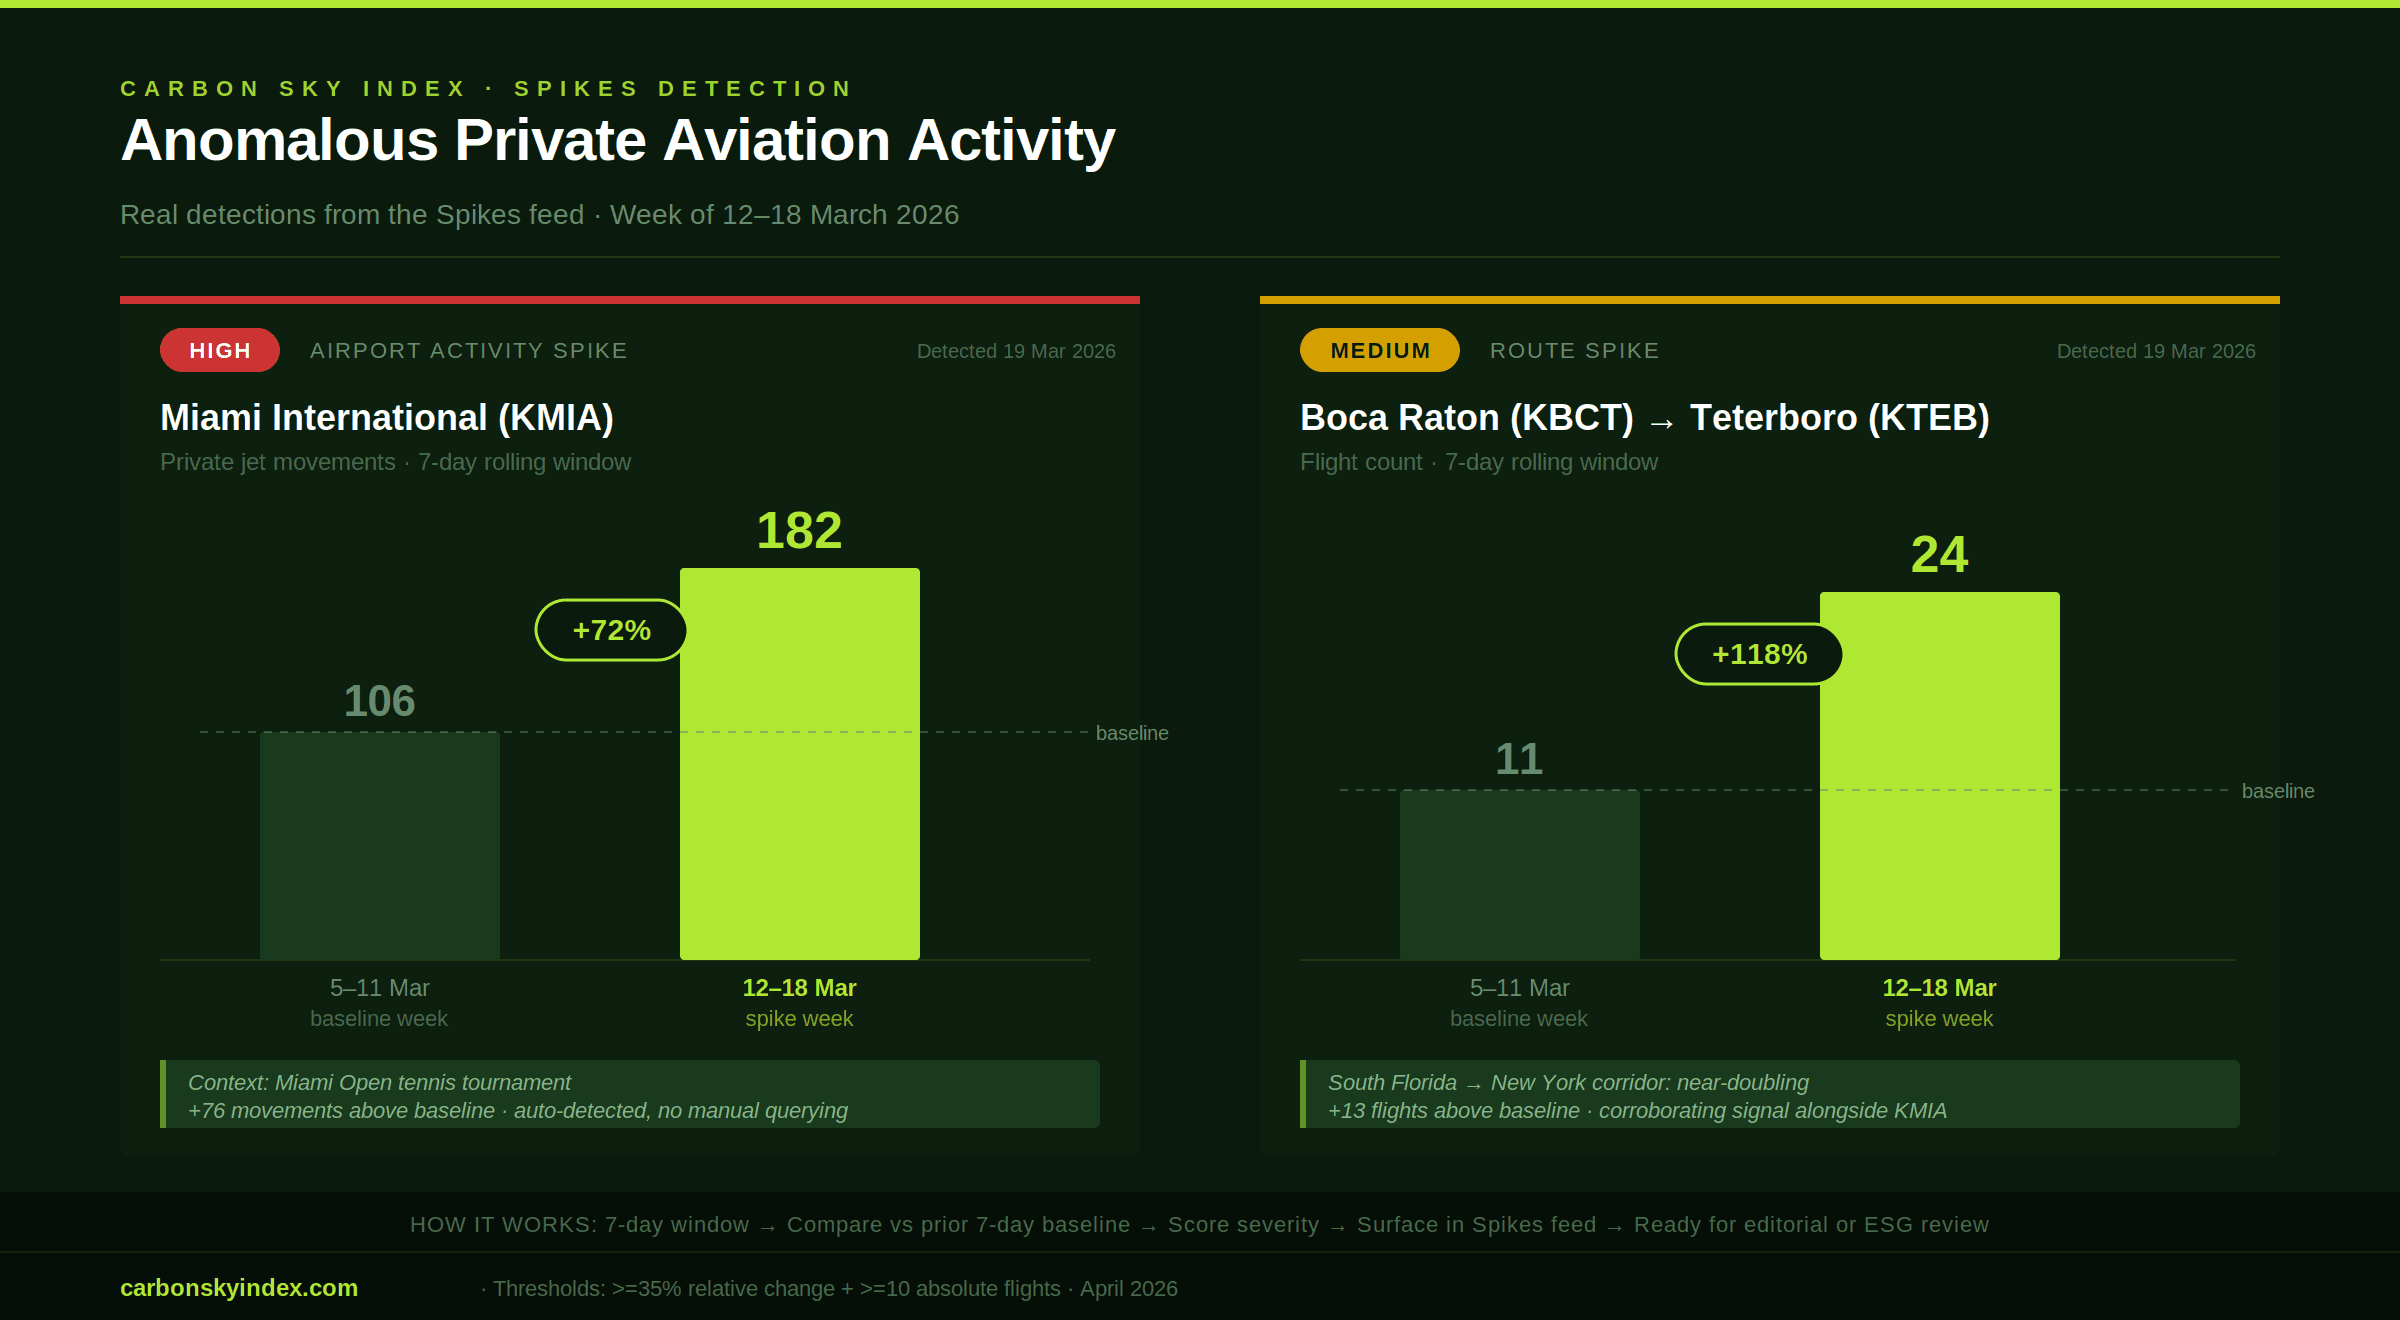
- A Spikes detection system that surfaces unusual emissions events — sudden increases in activity, outlier routes, fleet-wide anomalies
- A tiered access model
For example, here are two real spikes detected by the platform in March 2026:
The platform operates without owner attribution.
Data is presented at the tail number and aircraft type level, not linked to named individuals.
The methodology is published openly, meaning figures from Carbon Sky Index can be cited with a clear audit trail. That's not true of most alternatives.
Best for: Journalists needing citable figures, ESG analysts building aviation exposure assessments, lenders and insurers doing asset-level due diligence, sustainability researchers.
AdsbExchange / OpenSky Network
These are raw flight tracking data sources used by researchers and developers working with ADS-B data. They provide aircraft position data without processing it into emissions figures.
OpenSky Network is a non-profit research consortium frequently cited in academic papers.
AdsbExchange is notable for explicitly not applying LADD filtering, making it a commonly referenced raw source for US-registered aircraft.
Getting from raw ADS-B records to a usable CO₂ figure requires applying a methodology: fuel burn coefficients by aircraft type, flight phase segmentation, great-circle distance corrections.
That processing work is what separates a raw data source from an emissions intelligence platform.
Best for: Researchers who want to build their own pipeline or verify underlying flight records. Not suitable for direct use in ESG reporting or journalism without significant additional processing.
Flightradar24
Flightradar24 is one of the most widely recognised flight tracking platform globally, with a consumer-oriented interface and broad aircraft coverage.
Best for: Live flight tracking
Climate TRACE (Aviation Sector)
Climate TRACE is a coalition effort to produce independent emissions inventories across all sectors, including aviation.
Their aviation data covers commercial and private flights at a sector level, primarily using satellite and ADS-B data combined with fuel consumption statistics.
The scope is different from what professional users typically need. Climate TRACE produces country-level and sector-level aggregates, not aircraft-level profiles.
It's useful for understanding aviation's contribution to global emissions in a macro context, but doesn't support the aircraft- or operator-level analysis needed for ESG due diligence or investigative journalism.
Best for: Policy researchers and academics working at a macro scale. Not suitable for aircraft-level or fleet-level professional analysis.
EUROCONTROL Data Services
EUROCONTROL, the European Organisation for the Safety of Air Navigation, publishes flight data and has developed emissions estimation methodologies, including the EMEP/EEA methodology that informs several commercial platforms.
Their data services are primarily aimed at aviation regulators, air navigation service providers, and academic researchers.
Access to granular data requires institutional agreements, and the interface is built for technical specialists.
he methodology work is foundational - EUROCONTROL's LTO emission factors are what rigorous platforms should be building from, but it's not accessible for most commercial or journalistic use cases day-to-day.
Best for: Regulators, ANSPs, and academic researchers working within the European aviation system.
Media-Driven Trackers
A cluster of media and activist-adjacent tracking accounts and tools emerged around 2022 following high-profile coverage of celebrity private jet use.
Several faced legal challenges around owner attribution and the publication of real-time location data. Some were suspended or shut down.
These tools served a specific journalistic function during a particular moment, but they're not institutional data sources.
Figures aren't methodologically documented, coverage is inconsistent, and the owner-attribution approach creates legal exposure for anyone republishing the data.
Best for: General public awareness. Not suitable for professional ESG reporting, financial analysis, or institutional research.
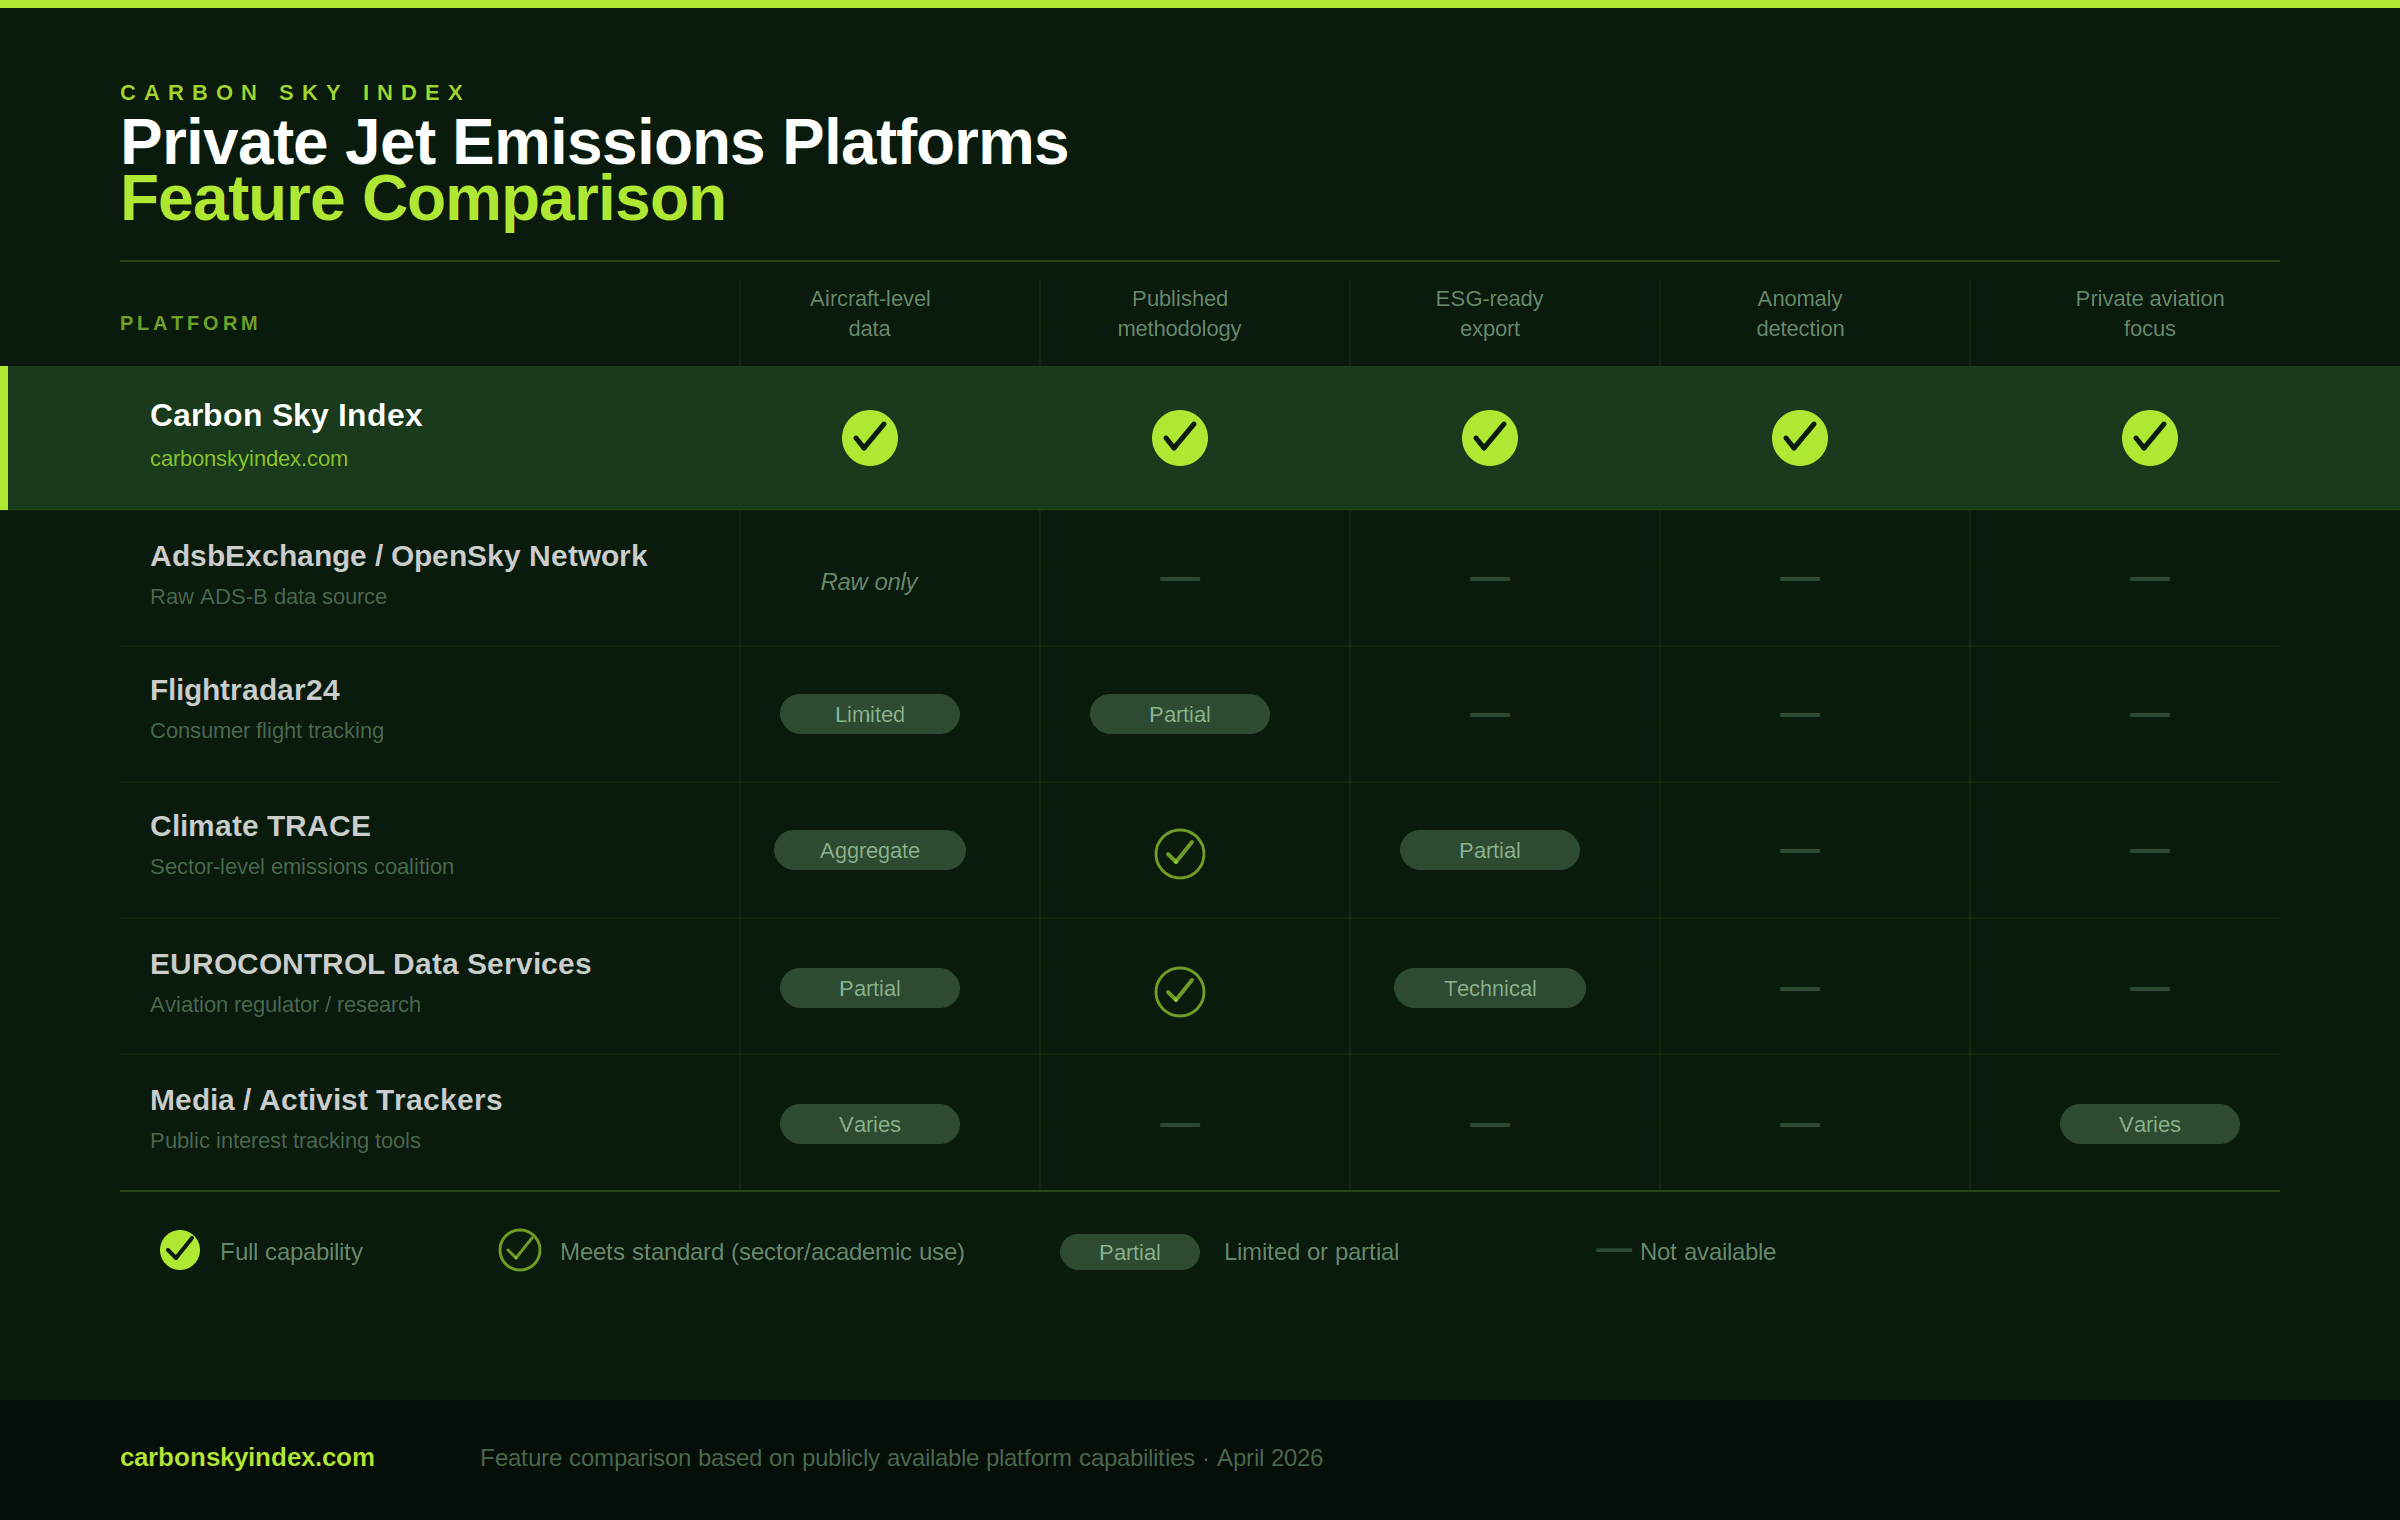
How the Platforms Compare
Why Aircraft Type Changes Everything
The most important thing a private aviation emissions platform can do is apply aircraft-type-specific fuel burn data rather than a flat distance multiplier.
The variation across the fleet is enormous and it's the difference between a figure that's useful and one that's misleading.
The graph below shows CO₂ output per flight hour for a cross-section of aircraft types tracked on Carbon Sky Index, derived from the platform's published methodology using EUROCONTROL LTO coefficients and aircraft-specific fuel burn data:
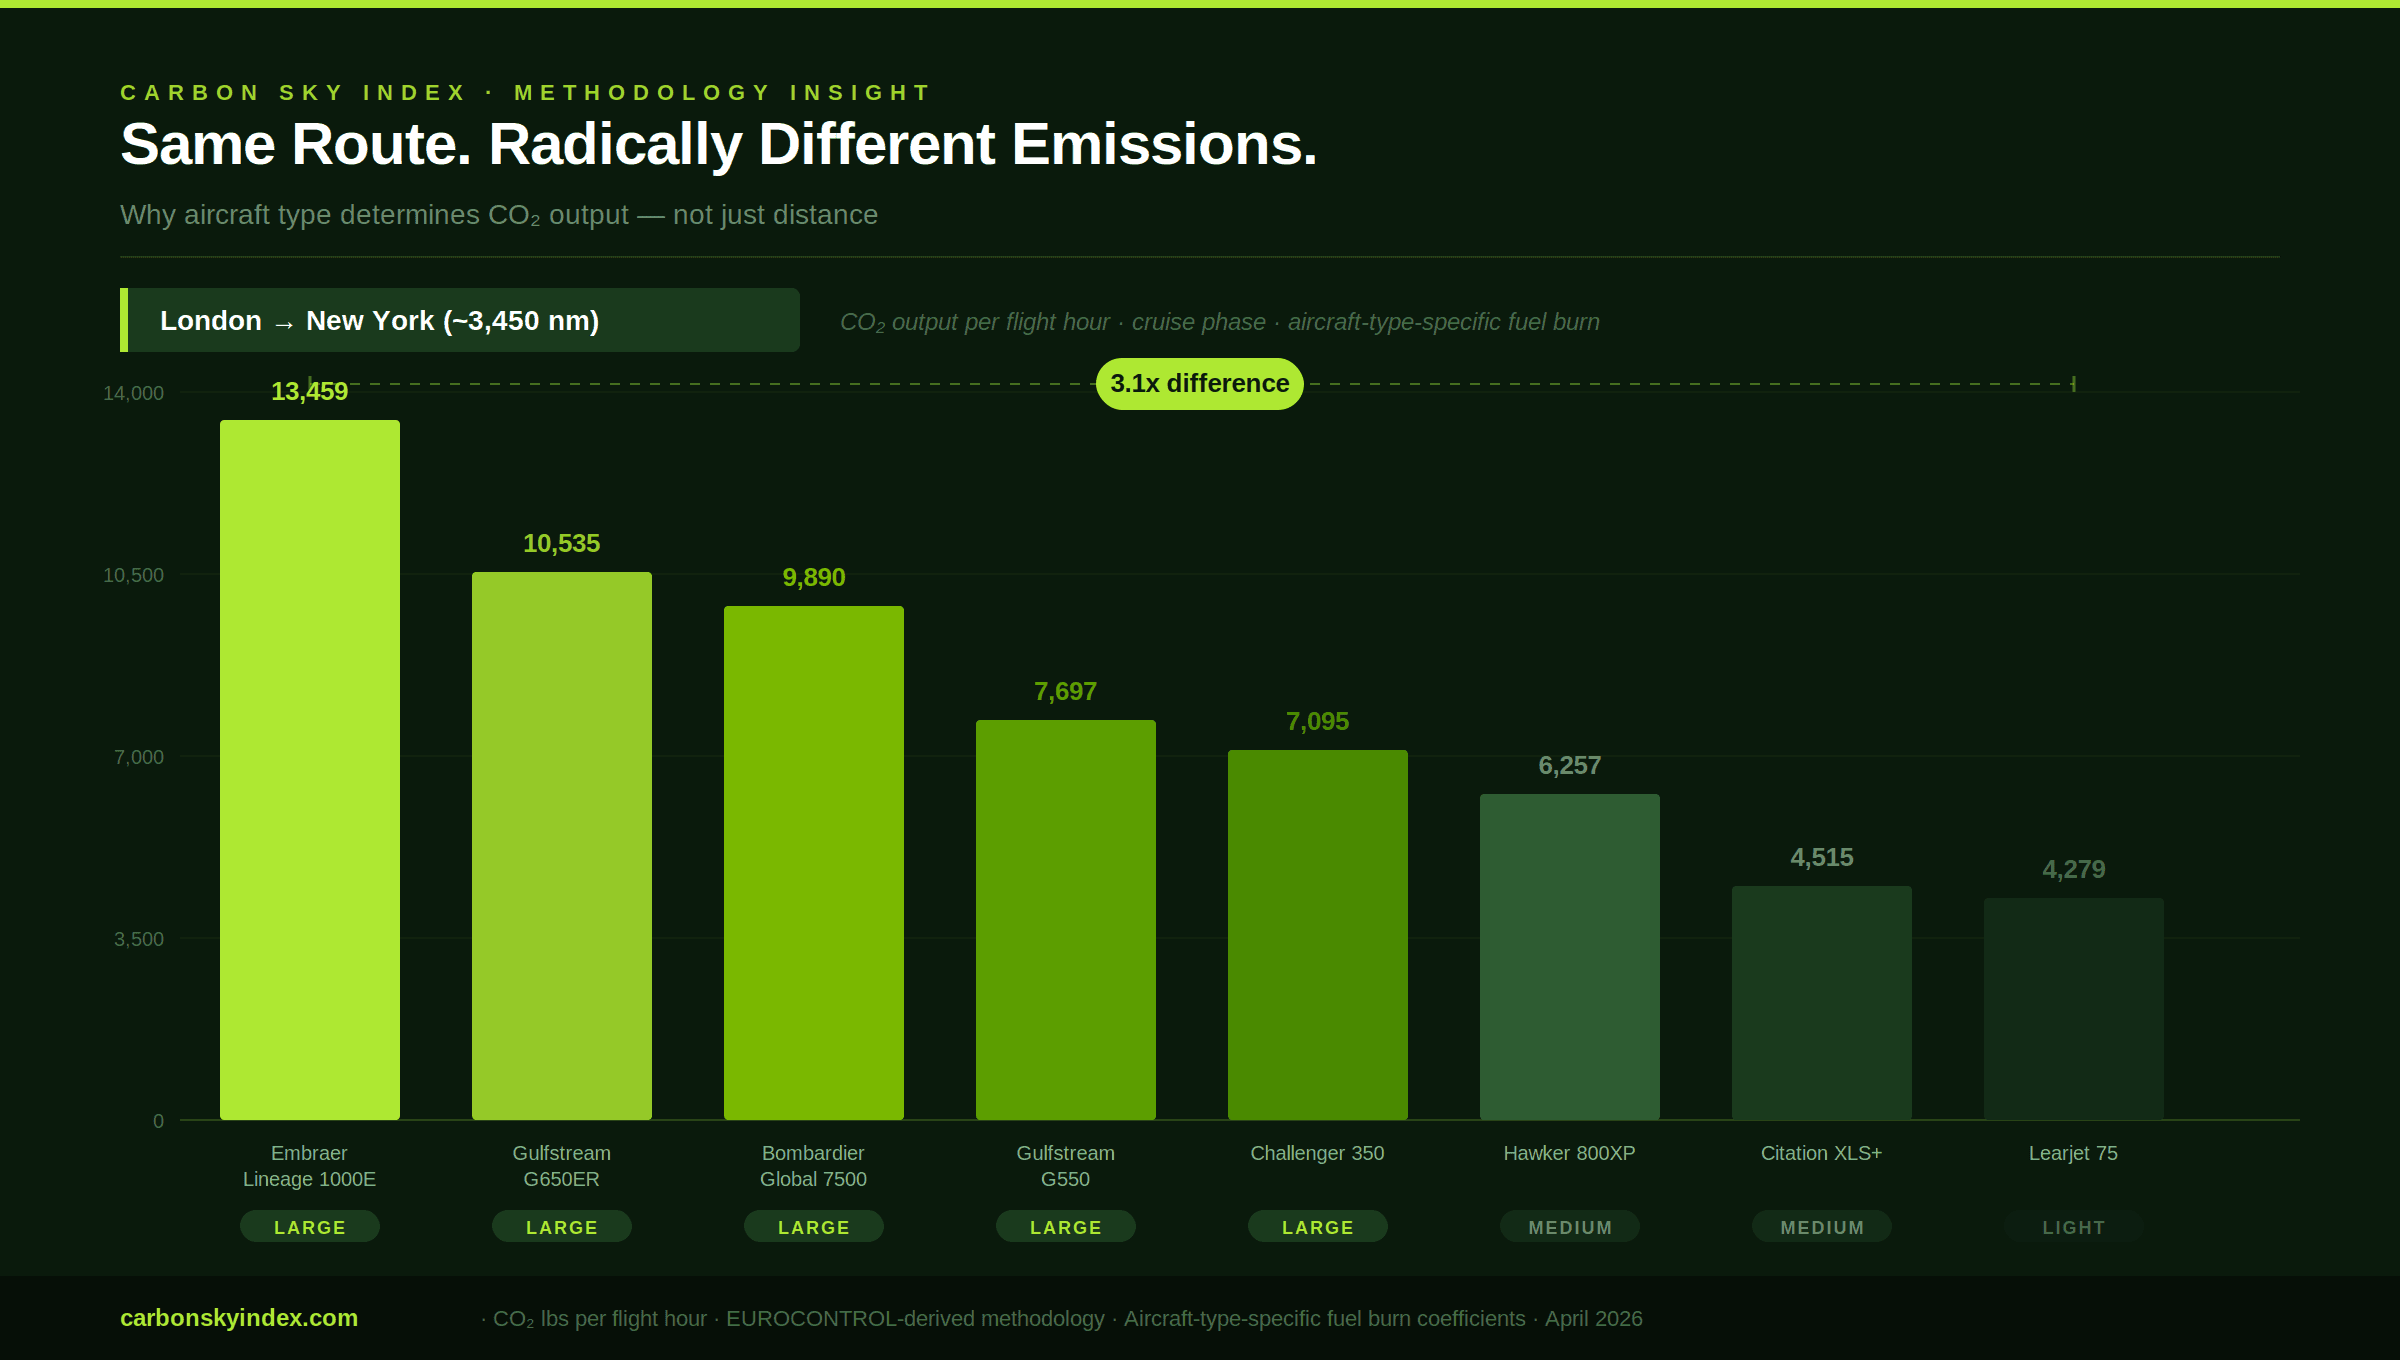
The spread is striking.
An Embraer Lineage 1000E (essentially a converted regional airliner used as a VIP transport) produces over 13,000 lbs of CO₂ per hour.
A Bombardier Learjet 75 produces around 4,279 lbs. Both are private jets. Both would be counted in a fleet-level analysis.
A platform that assigns both the same per-kilometre emissions figure isn't doing emissions analysis, it's doing distance analysis.
This is the core reason why published, aircraft-type-specific methodology matters.
It's also why Carbon Sky Index tracks over 22,000 individual aircraft rather than working from fleet-level averages.
The Practical Question: Which Platform for Which Use Case?
If you're a journalist writing about private aviation emissions and you need figures you can publish with a cited methodology, Carbon Sky Index is currently the only platform designed specifically for this. The data is aircraft-level, the methodology is documented and citable, and the platform doesn't attribute flights to named individuals - which matters for anyone publishing at scale.
If you're an ESG analyst building aviation exposure assessments for a portfolio or client, you need aircraft-level historical data with export functionality. That points to Carbon Sky Index's Pro tier, which covers the full fleet, gives you route-level and airport-level breakdowns, and exports in formats that feed into existing reporting workflows.
If you're an aviation lender or insurer and you want to understand the emissions profile of specific assets or operators, the use case is more specific, such as anomaly detection, operational pattern analysis, benchmarking against fleet type averages. Carbon Sky Index's Spikes system and aircraft profile pages are built around this kind of analysis.
If you're doing academic research at a macro level and need sector-wide or country-level data, Climate TRACE and EUROCONTROL's published datasets are worth starting from. If you need aircraft-level granularity, you'll need either a custom pipeline or a purpose-built platform that has already done that work.
If you want raw ADS-B records to build your own methodology or verify an existing analysis, AdsbExchange and OpenSky are established starting points for raw flight record data.
A Note on Methodology
The single biggest differentiator between platforms in this space isn't coverage or interface - it's whether the emissions figures are defensible.
A flat per-kilometre CO₂ estimate applied uniformly across aircraft types will produce numbers that look plausible but don't reflect actual fuel consumption.
Platforms that publish their methodology and specifically their aircraft-type fuel burn coefficients, flight phase assumptions, and distance calculation approach are the ones worth using for anything that might be cited, published, or incorporated into a formal report.
Carbon Sky Index publishes its full methodology here.
A number without an audit trail is not usable for ESG reporting and creates reputational risk for anyone publishing it as fact.
Summary
The market for private jet emissions data has matured quickly, but most of the available tools were built for different purposes such as consumer flight tracking, academic research, macro policy analysis and have added emissions layers as a secondary feature.
Carbon Sky Index is the only platform in this space built from the ground up as an emissions intelligence tool for professional use, with a published methodology, aircraft-level granularity covering 22,580 aircraft, anomaly detection, and the institutional packaging that journalists, analysts, and financial teams actually need.
For anyone whose work requires defensible figures at the aircraft or fleet level, that's the relevant distinction.